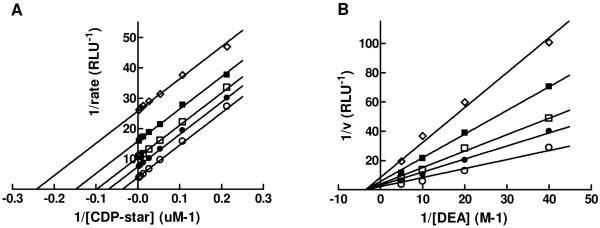
Figure 6.
Lineweaver-Burk plots for compound 1 MOA experiments. Inhibition of TNAP was measured in the presence of the following concentrations of 1: 0 μM (open circle), 0.195 μM (closed circle), 0.39 μM (open square), 0.78 μM (closed square), 1.56 μM (open diamond). The concentrations of DEA and CDP-star were equal to 100 mM (A) and 50 μM (B), respectively. The Ki values for compound 1 are 0.34 μM (Fig. 6A) and 0.59 μM (Fig. 6B).

