
Table 1.
SAR of TNAP inhibitors from HTS and purchased analogues
| CMPD | TNAP IC50 μM luminescenta |
|
|---|---|---|
| 1 | 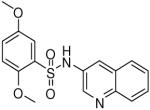 |
0.19 (0.03, 0.41, 43) |
| 2 | 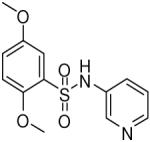 |
1.06 (0.76, 1.48, 6) |
| 3 | 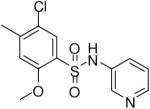 |
0.51 (0.28, 0.66, 3) |
| 4 | 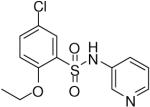 |
0.54 (0.35, 0.65, 4) |
| 5 | 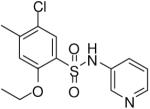 |
0.69 (0.24, 1.01, 6) |
| 6 | 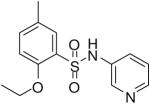 |
1.13 (0.53, 1.93, 4) |
| 7 | 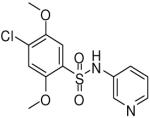 |
1.13 (0.49, 1.46, 4) |
| 8 | 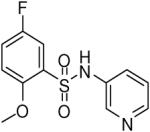 |
1.29 (0.73, 1.56, 4) |
| 9 | 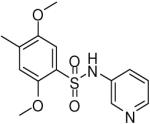 |
1.49 (0.64, 2.35, 3) |
| 10 | 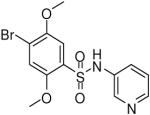 |
1.55 (1.27, 1.83, 2) |
| 11 | 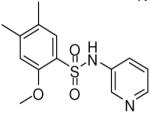 |
1.68 (1.07, 2.13, 3) |
a
TNAP IC50 data are presented as the geometric mean followed in parentheses by the lower and upper limits of the mean and the number of replicates.