
Table 2.
SAR and ADME profiles of follow-up compounds of lead TNAP inhibitor 1
| CMPD | TNAP IC50 μM luminescenta |
Microsomal/ Plasma Stabilityb |
PAMPA (% FLUX)c |
Solubility (μg/mL)d |
|
|---|---|---|---|---|---|
| 1 | 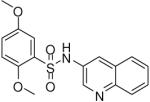 |
0.19 (0.03, 0.41, 43) | 78 / 97 | 58 | 138.2 |
| 18 | 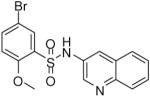 |
0.12 (0.04, 0.25, 16) | 49 / 66 | 54 | 37.9 |
| 19 | 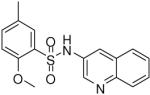 |
0.65 (0.50, 0.94, 4) | 48 / 91 | 7 | 71.6 |
| 20 | 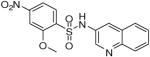 |
0.74 (0.74, 0.74, 1) | 56 / 96 | 11 | 178 |
| 21 | 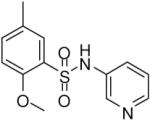 |
1.85 (0.69, 3.36, 23) | 39 / 98 | 83 | 28.5 |
| 22 | 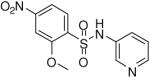 |
3.16 (2.27, 3.64, 4) | 68 / 99 | 51 | 1.1 |
a
TNAP IC50 data are presented as the geometric mean followed in parentheses by the lower and upper limits of the mean and the number of replicates.
b
Percent remaining after incubation for 30 min. at 37 °C.
c
PAMPA flux values assessed according to previously published methods.15
d
Solubility measurements performed in an aqueous buffer solution at pH 7.4, in duplicate.