
Figure 3. MCF10A and PTEN+/− cells undergo apoptosis, while the PTEN−/− cells survive in minimal media.
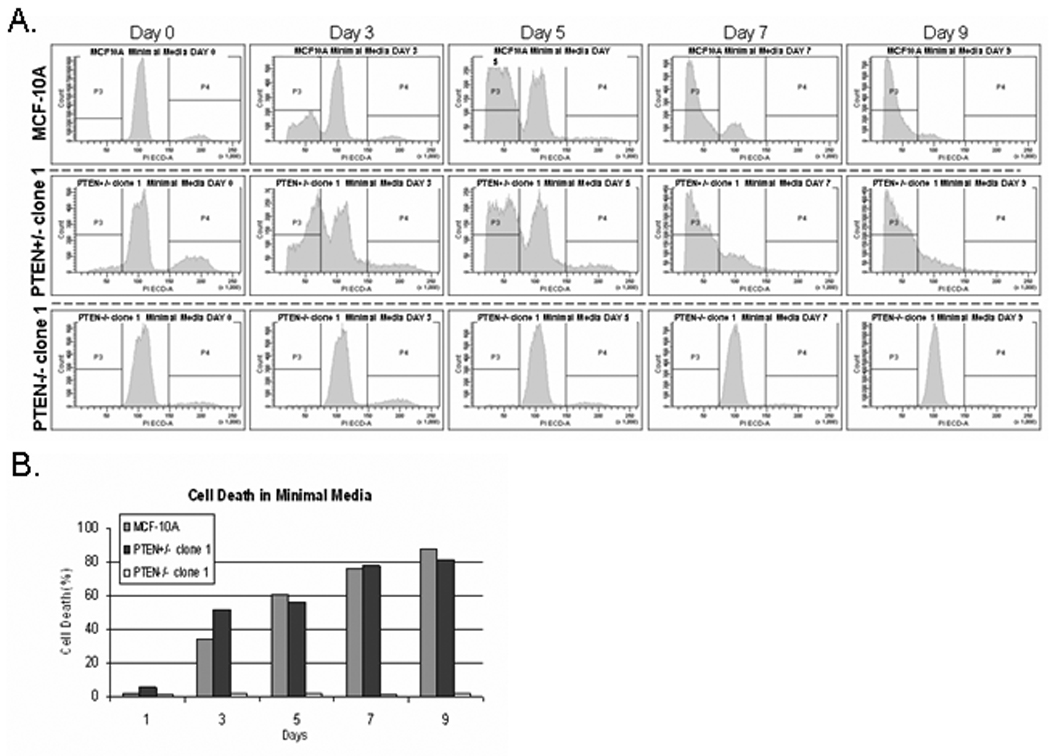
(A.) Flow cytometry analysis of PI stained MCF10A and PTEN+/− cells reveals massive cell death beginning at day 3 and continuing through day 9 until only a sub-G1 population is left. However, the PTEN−/− cells continue to survive and slowly cycle due to the presence of a minimal G2 peak present until day 9 when the cells become growth arrested at confluence. (B.) Graphical representation of the cell death minimal media.