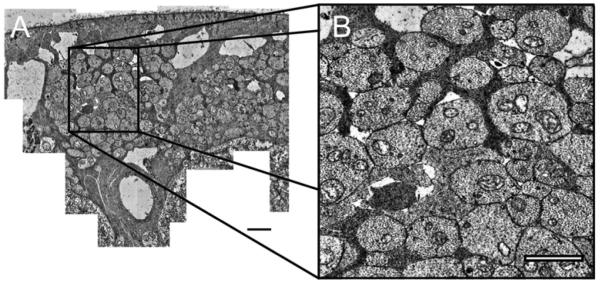
Figure 3.
(A) A montage of a nerve fiber bundle from subject 57204 in angular section ITL. Montages were transferred to a tablet PC, where cellular structures were traced, counted, and measured. The montage was used to keep track of photographed high magnification images of RGC axons using the Image J’s Region of Interest (ROI) Manager to ensure that there were not any repeat or missed images of any RGC axons within the nerve fiber bundle. Scale bar, 2 μm (B) Medium magnification (11000X to 14000X) TEM image used to create montage in (A). Scale bar, 1 μm.

