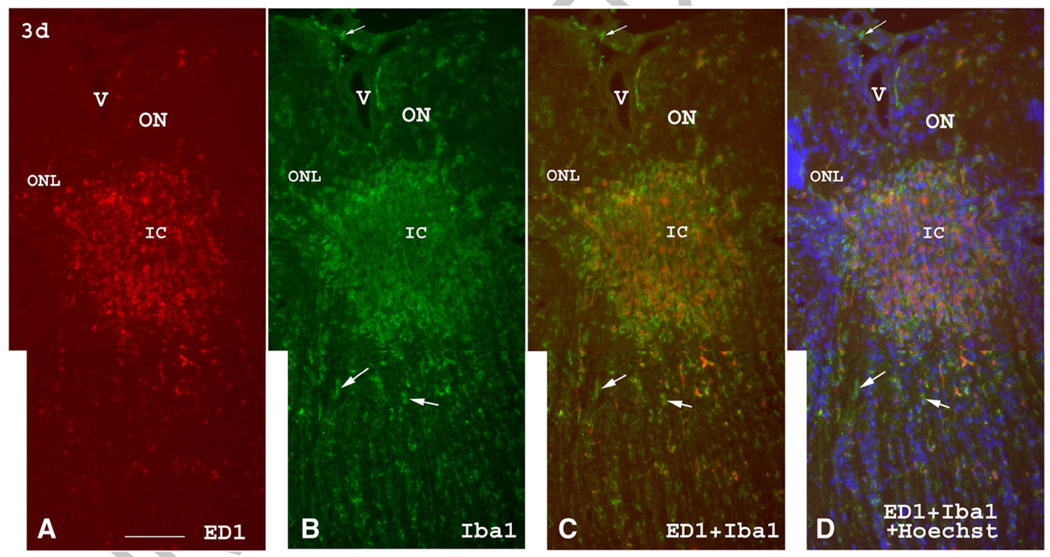
Fig. 5.
ED1 (red) and Iba1 (green) immunolabeling of the anterior, intrascleral, and postscleral portions of the ON three days post-induction of rAION. (A) There is an intense accumulation of ED1(+) cells in the intrascleral and immediate posterior portions of the ON (corresponding to the ischemic core, IC). Posterior to the highly infiltrated ED1(+) area, a few scattered ED1(+) cells are present. (B) Iba1 immunostaining shows a similar accumulation of Iba1(+) round or ameboid cells in the intrascleral portion of the ON and in the ischemic core, as well as some Iba1(+) cells posterior to the core lesion. Most Iba1(+) cells are ED1(−) (arrows) behind the ischemic core. (C) Merged view. The accumulated ED1(+)/Iba1(+) cells are present in the ischemic core (IC). (D) Merged view with nuclear (Hoechst) counterstain. ED1(+)/Iba1(+) cells are present in the anterior ON and are interspersed among the oligodendrocyte nuclei (blue) posterior to the ischemic core, with more Iba1(+) cells than ED1(+) cells being present. The Iba1(+)/ED1(−) cells (arrows) posterior to the ischemic core are probably resident microglia. V: blood vessel; ONL: outer nuclear layer; IC: ischemic core. Bar=50 µm. (For interpretation of the references to colour in this figure legend, the reader is referred to the web version of this article.)

