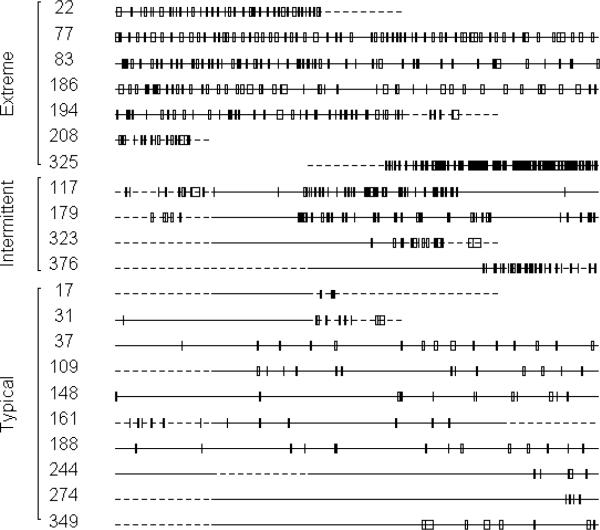
Figure 2. Inpatient Hospitalizations among High Utilizers.
Hospital admissions over time in a selected group of members. Members marked “Extreme” had the highest rates of hospital admission in the analysis dataset. The “Intermittent” high utilizers were noted to have periods of extreme utilization punctuated by periods of minimal utilization. The “Typical” high utilizers were a random sample of the lower 50th percentile of the high utilizer group. Solid timeline segments indicate years with complete enrollment, dashed segments indicate years with partial (<12 month) enrollment. Each box on the line represents an admission, with the width proportional to the length of stay. The entire left-to-right span represents the five years of the study period.

