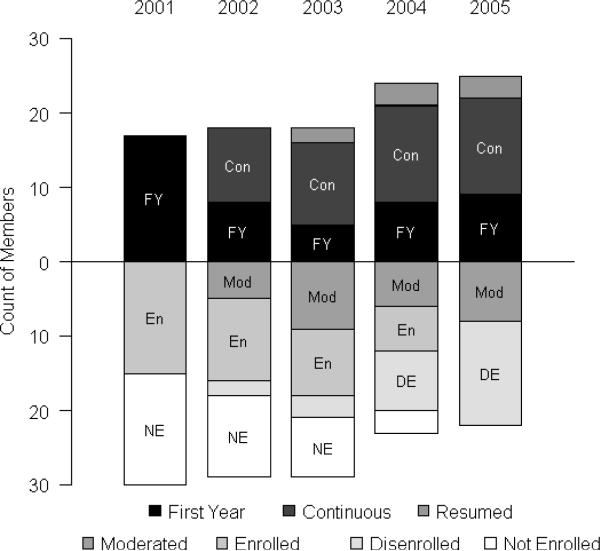
Figure 3. Utilization Categories by Year.
Categorical description of members in the analysis dataset during the period of study. Bars above the base line represent active high utilizers, bars below represent those who were inactive. Inclusion of all active high utilizers in 2001 in the “First Year” category is arbitrary. FY= First Year high utilizers; Con=Continuous high utilizers; Res=Resumed after a period of moderation. Mod=Moderated high utilizers; En=Enrolled, but not in active high utilization; DE=Disenrolled after a period of enrollment; NE=Not Enrolled yet.

