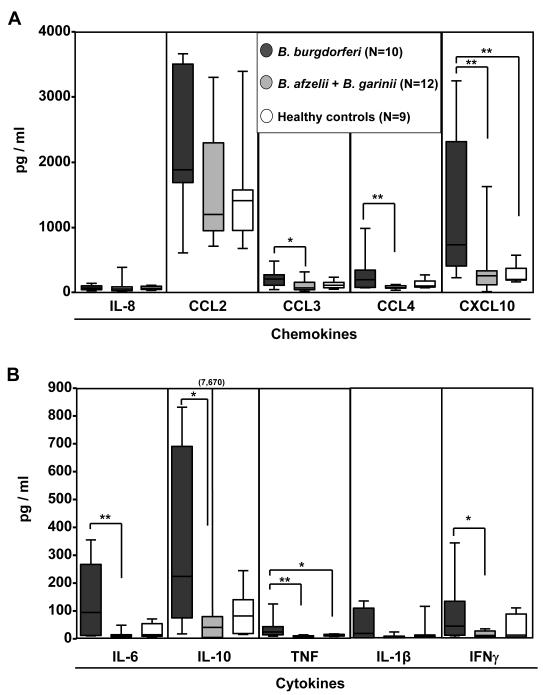
Figure 4. Serum levels of chemokines and cytokines.
Chemokine and cytokine levels were assessed in serum samples from 22 of the 30 patients from whom the Borrelia isolates were obtained and from 9 healthy donors with no history of Lyme borreliosis. Of the 22 patient sera, 10 were from U.S. patients with B. burgdorferi infection, and 12 were from Slovenian patients, 8 with B. afzelii infection and 4 with B. garinii infection. A) Chemokine and B) cytokine expression was determined using bead-based multiplex assays. The box in the graph represents 25th and 75th percentiles, the horizontal line in the box is the median and the lines outside the box are the 5th and 95th percentiles. *P ≤ 0.05, **P ≤ 0.01, ***P ≤ 0.001.

