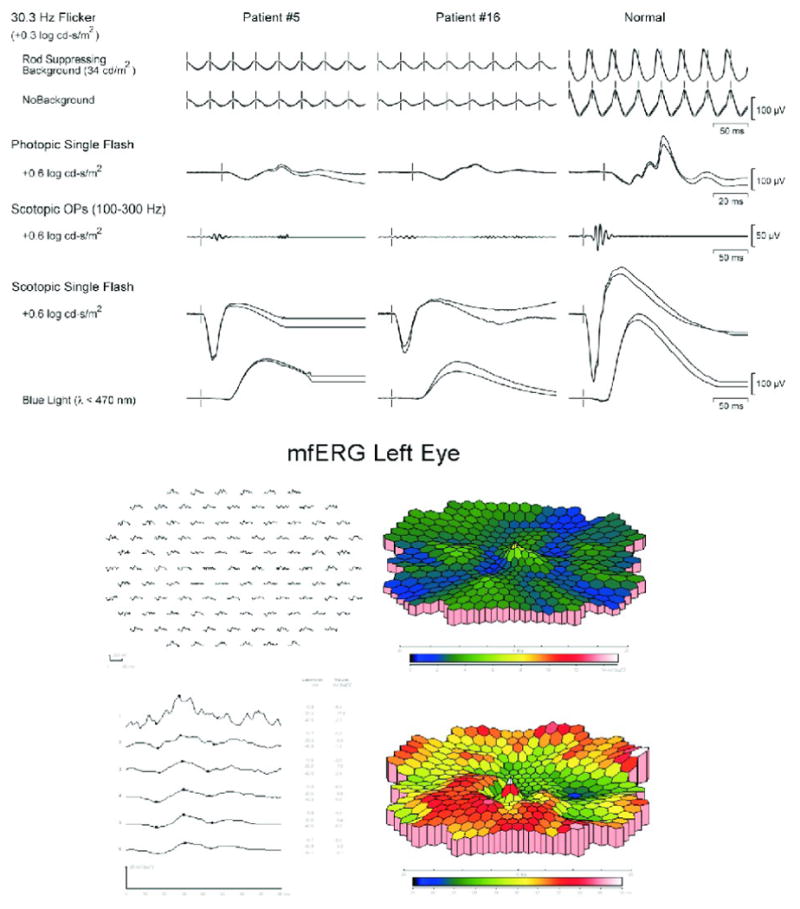
Figure 2.

Representative Electroretinograms: A: Full field ERG for the 2 patients in Figure 1 showing mildly to moderately subnormal responses of rods, dark-adapted cones, and scotopic bright flash responses. Rod and cone implicit times were mildly prolonged. B: Multifocal ERG for the right eye of patient #5 showing loss of amplitude with patchy prolonged implicit times, both peripherally and centrally.
