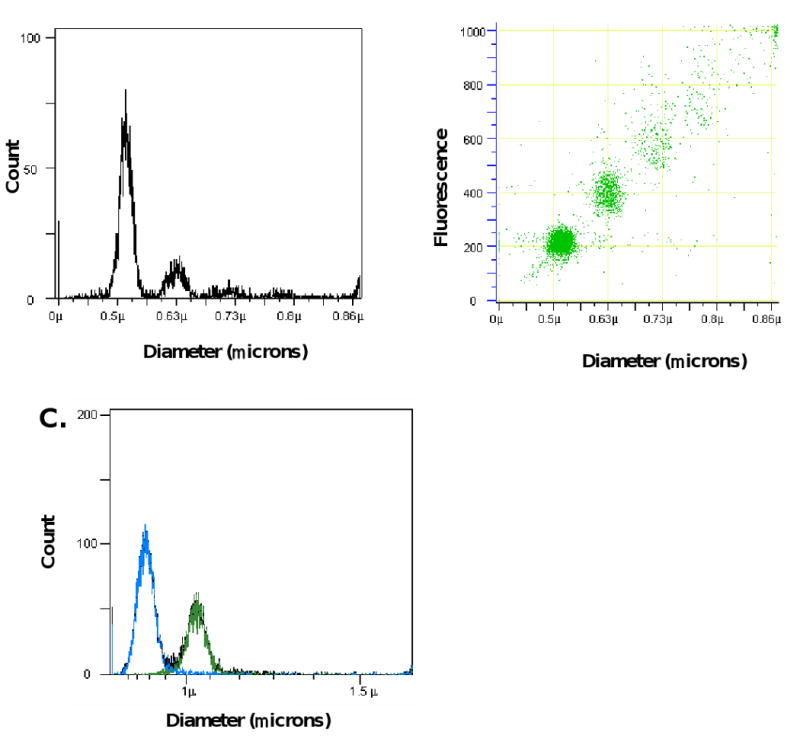
Figure 2.

Analysis of fluorescent microspheres using impedance-based flow cytometry. A. Histogram of 0.52 μm polystyrene fluorescent microspheres showing particle distribution as a function of particle size. B. Dot plot of particle diameter versus relative fluorescence for 0.52 μm microspheres. Some aggregates were observed. C. Histograms generated by measurement of electronic volumes of a mixed population of microspheres with diameters of 0.78 μm (blue) and 1.01 μm (green) microspheres showing full resolution of the two populations. Fluorescence was monitored at 488 nm.
