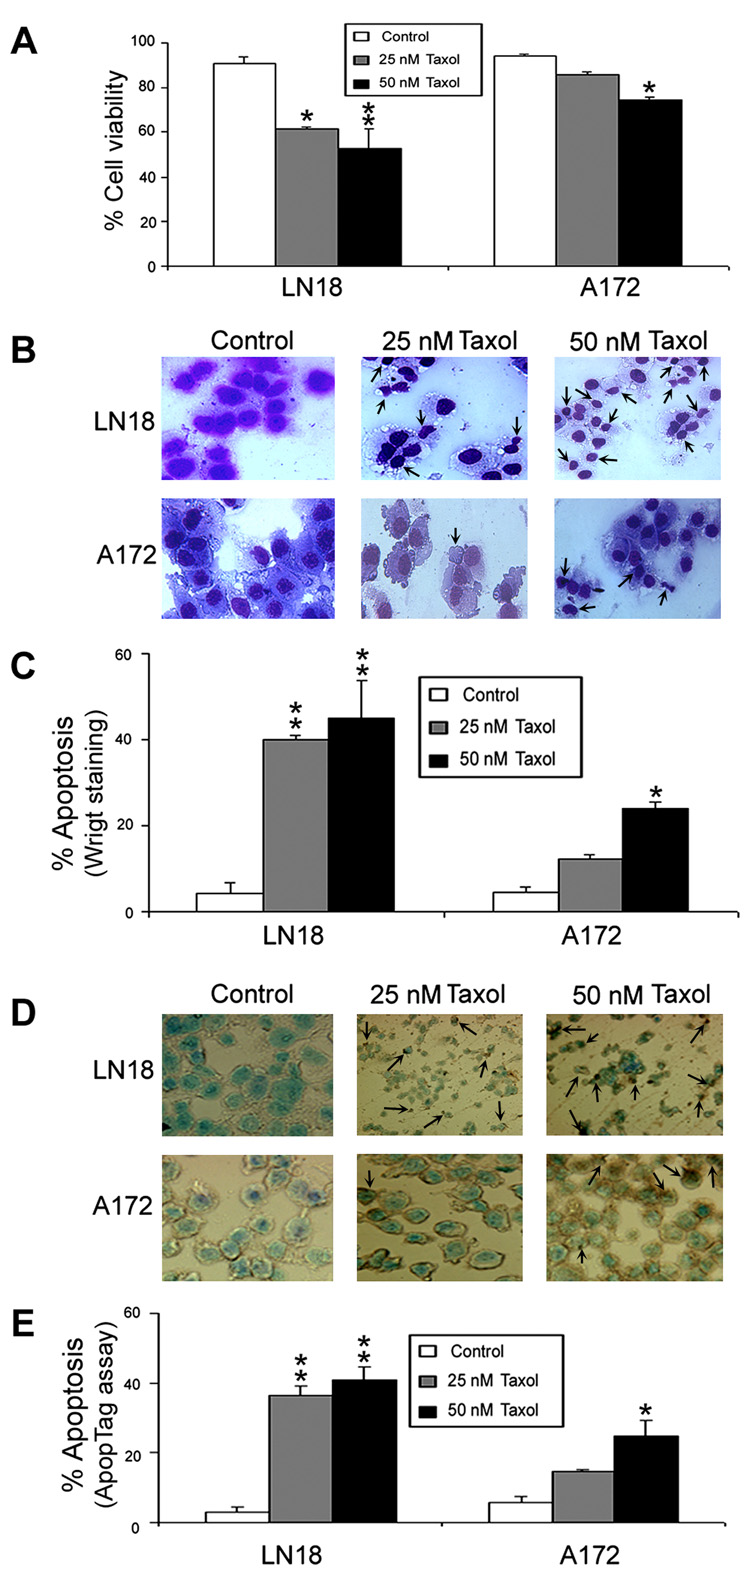
Fig. 2. Determination of residual cell viability and apoptosis in LN18 and A172 cells.
Treatments (24 h): Control, 25 nM Taxol, and 50 nM Taxol. (A) Bar diagrams showing residual cell viability based on trypan blue dye exclusion test. (B) Wright staining to examine the morphological features of apoptotic cells (arrows). (C) Bar diagrams indicating percent apoptotic cells based on Wright staining. (D) ApopTag assay to examine the morphological features and DNA fragmentation in apoptotic cells (arrows). (E) Bar diagrams indicating percent apoptotic cells based on ApopTag assay. Significant difference from control value was indicated by *p<0.05 or **p<0.01.

