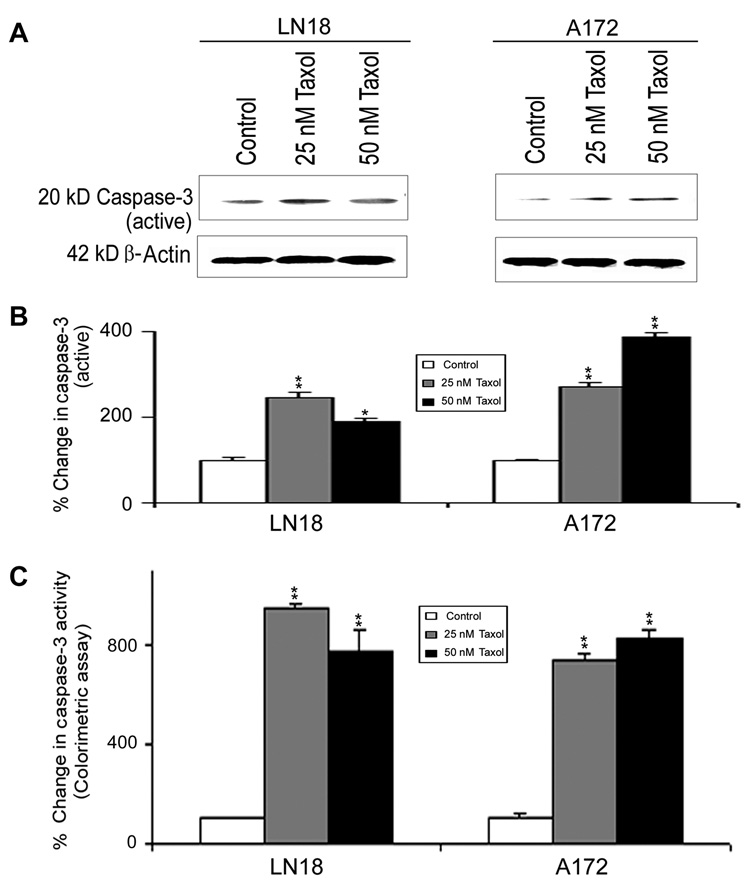
Fig. 6. Western blotting and colorimetric assay for determining caspase-3 activation and activity in LN18 and A172 cells.
Treatments (24 h): Control, 25 nM Taxol, and 50 nM Taxol. (A) Representative Western blots to show increased levels of active caspase-3 expression. Expression of β-actin was examined to ensure almost uniform protein loading in all lanes. (B) Bar diagrams showing densitometric determination of levels of active caspase-3. (C) Colorimetric assay for determination of caspase-3 activity. Significant difference between control and a treatment was indicated by *p<0.05 or **p<0.01.

