
Figure 1. Time-course of VCD-induced ovotoxicity.
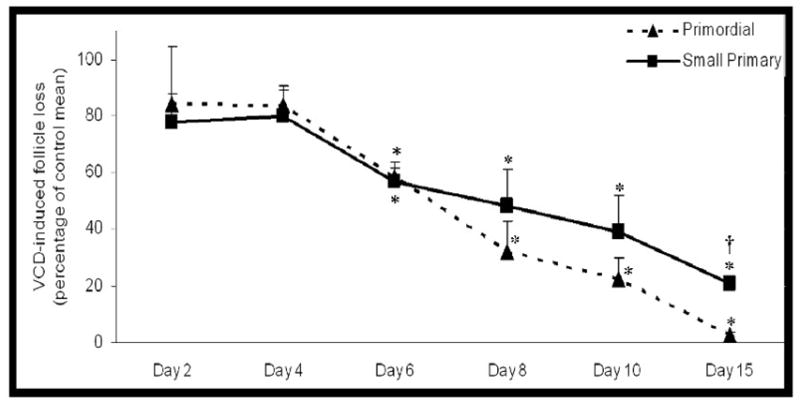
Ovaries from PND4 F344 rats were cultured with control medium or medium containing VCD (30 μM). Following incubation, ovaries were collected and processed for histological evaluation as described in materials and methods. Primordial (broken line) and small primary (solid line) follicles were classified and counted. Follicle numbers were expressed as percentage follicles remaining relative to the respective controls ± SE; n = 3–5 ovaries per timepoint. * P < 0.05, Different from control. †P < 0.05, Different from percentage primordial follicle loss. d2, 4, 8, 10, 15; Adapted from Devine et al., (2002).