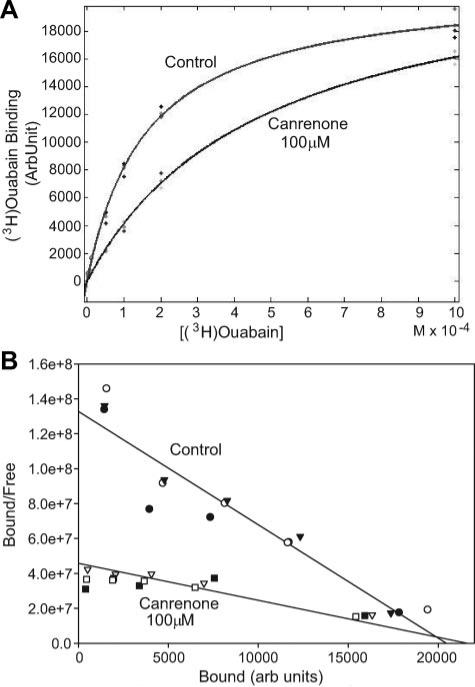
Figure 3.
A, (3H)ouabain binding data expressed as a function of (3H)ouabain concentration either without (control) or with canrenone at 100 μmol/L. Curves shown are fit to the average of 3 separate sets of experiments in the control and canrenone groups. The R2 value for both curve fits exceeded 0.97. B, The same experimental data transformed into bound/free vs bound (Scatchard plot) with regression lines fit to both the control and canrenone data. Note that the slopes of the lines (reflecting the reciprocal of the dissociation constant values) are quite different, whereas the intersections of these lines with the x axis (reflecting the reciprocal of the Bmax values) occur at essentially the same point. Quantifications of the dissociation constant and Bmax data were performed using nonlinear regression methods (MATLAB) on data represented in A; these data are presented in the online Data Supplement (Table S1).

