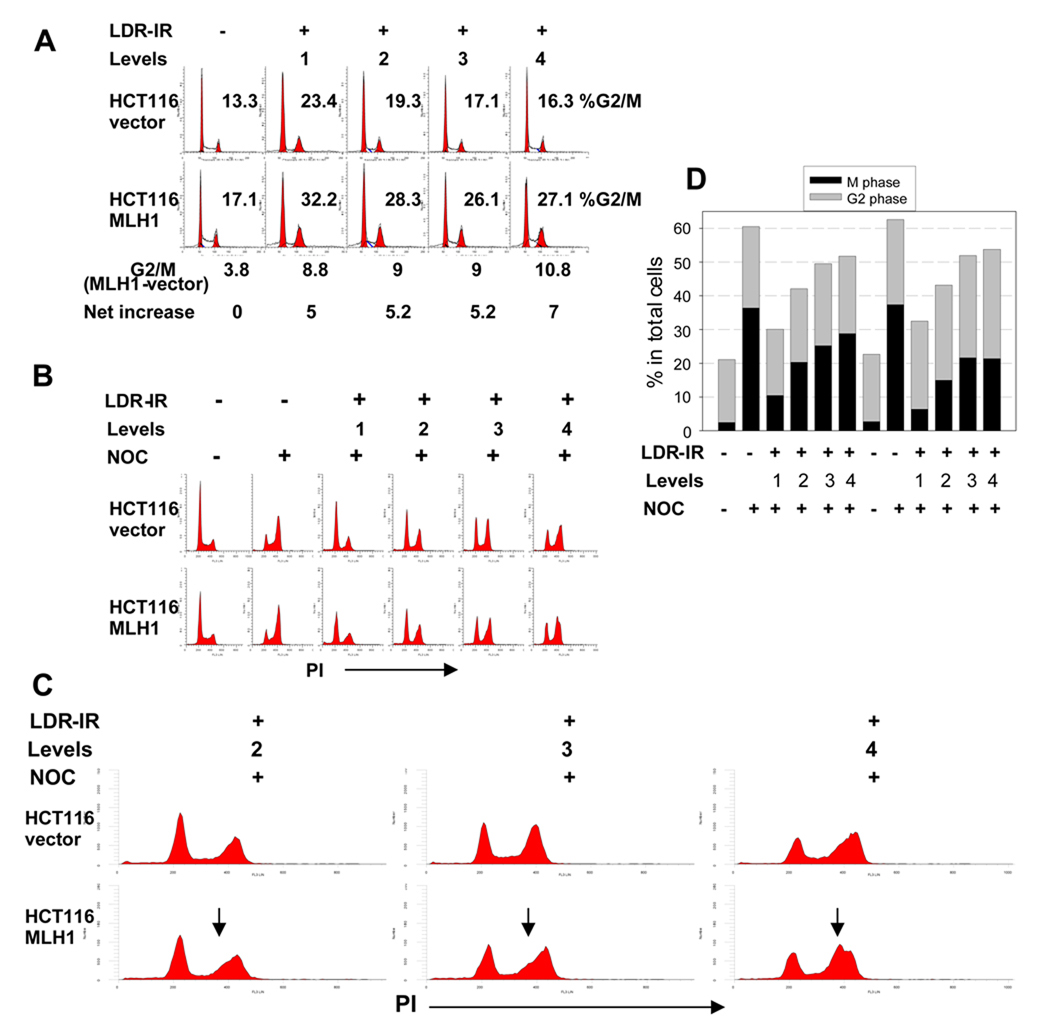
Figure 2.
HCT116MLH1 (MLH1+) cells demonstrate a greater late S population and a greater G2/M checkpoint arrest during prolonged LDR-IR than HCT116vector (MLH1−) cells. A. flow cytometry histograms show moderately increased G2/M population after 72 h LDR-IR in both cell lines with about 5 percentage points more G2/M fraction in the MLH1+ cells than in the MLH1− cells. B. flow cytometry histograms show inhibition of G1/S progression in both cell lines. The cells were exposed to LDR-IR for 72 h and NOC was added for the last 8 h of LDR-IR prior to harvesting. C. the expanded portion of Fig. 2B demonstrates a late S phase population (arrows) in the MLH1+ cells. D. Bar graph derived from the representative scatter plots of dual-parameter flow cytometry for phospho-histone H3 (Ser10) and PI showing that the MLH1+ cells have less mitotic cells than the MLH1− cells. All experiments were repeated at least twice.

