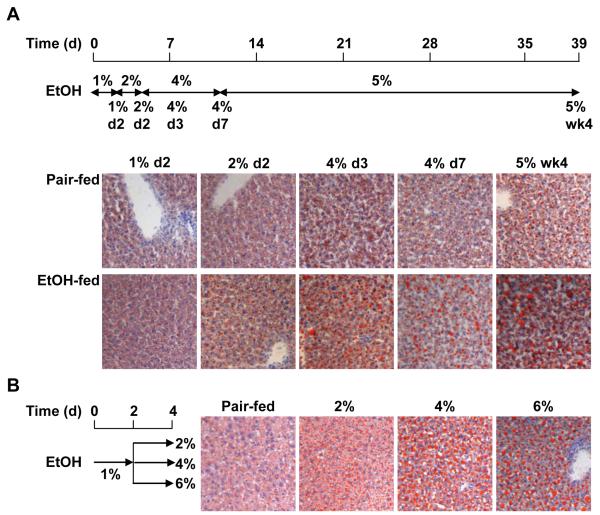
Figure 1.
Accumulation of neutral lipids in the liver of C57BL/6 mice after chronic or short-term ethanol feeding. Oil Red O staining was visualized in OCT embedded liver sections. A) Mice were allowed free access to diets containing increasing concentrations of ethanol or pair-fed control diets for 2 to 39 days, as indicated in the scheme. B) Mice were allowed free access to 1% ethanol diet for 2 days followed by increasing concentrations of ethanol-containing diets (2, 4 or 6%) for 2 days, as indicated in the scheme. Control animals were pair-fed a diet which isocalorically substituted maltose dextrins for ethanol. Images were acquired using a10X objective. Figures are representative of at least 3 mice in each experimental group.

