
Figure 3.
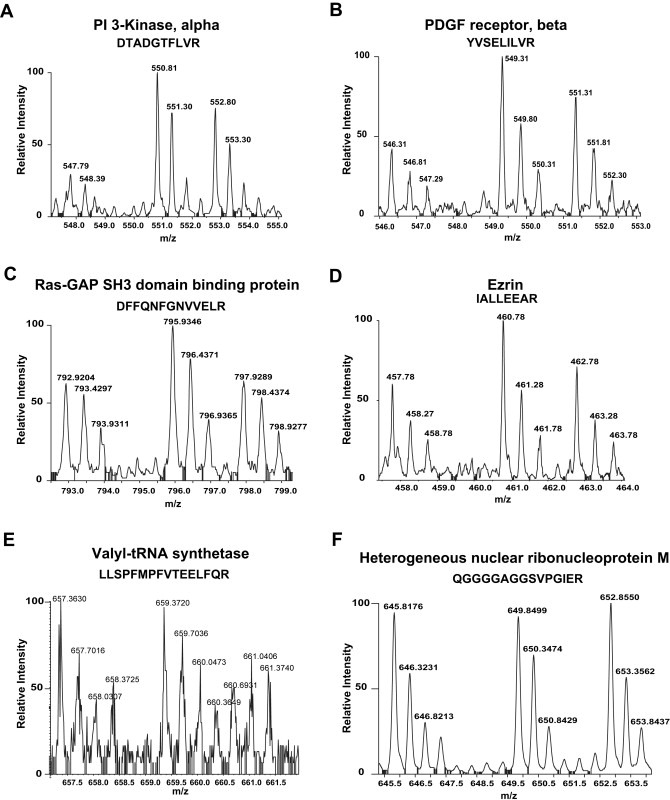
MS spectra of proteins showing different profiles identified in our SILAC screen. The 3 spectral peaks in each figure represent the mass shift of the same peptide. (A) A doubly charged peptide with the sequence DTADGTFLVR, from PI 3 kinase, alpha (1:3.3:2.2); (B) A doubly charged peptide with the sequence YVSELILVR from PDGF receptor, beta (1:2:1.5); (C) A doubly charged peptide with the sequence DFFQNFGNVVELR from Ras‐GAP SH3‐domain‐containing protein (1:1.5:1); (D) A doubly charged peptide with the sequence IALLEEAR from Ezrin (1:1.6:1.2); (E) A triply charged peptide with the sequence LLSPFMPFVTEELFQR from valyl‐tRNA synthetase (1:1.03:0.74); (F) A doubly charged peptide with the sequence from QGGGGAGGSVPGIER from heterogeneous nuclear ribonucleoprotein M (1:1.1:1.1). While some of the proteins (A–D) show involvement in PDGF signaling pathway as c‐Src substrates, some proteins do not show any involvement in PDGF signaling pathway (E) or do not show characteristic spectra as that of c‐Src substrates (F). The ratios shown in parentheses reflect ratio of abundance of peptides across three states (light:medium:heavy).