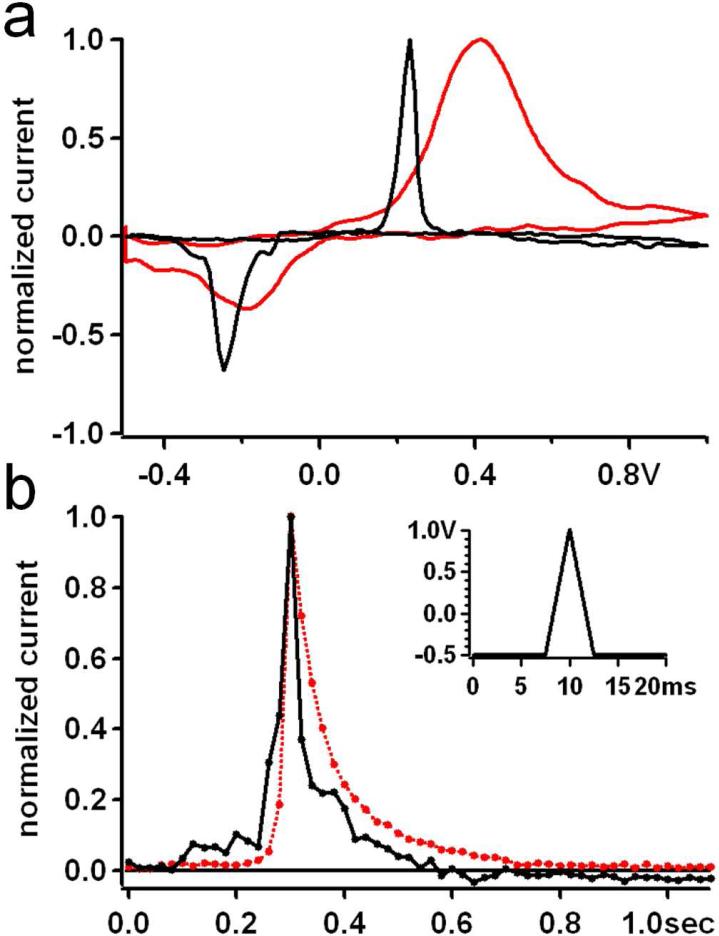
Figure 7.
(a) Typical cyclic voltammograms normalized to their peak oxidation values, obtained from chromaffin cells using either Pt microelectrodes (black) or CFEs (red). (b) Time course of voltammetric spikes for Pt (black) and CFE (red). Curves are the average of 20 individual spikes measured with 20 ms time resolution using the voltage waveform shown in the inset.

