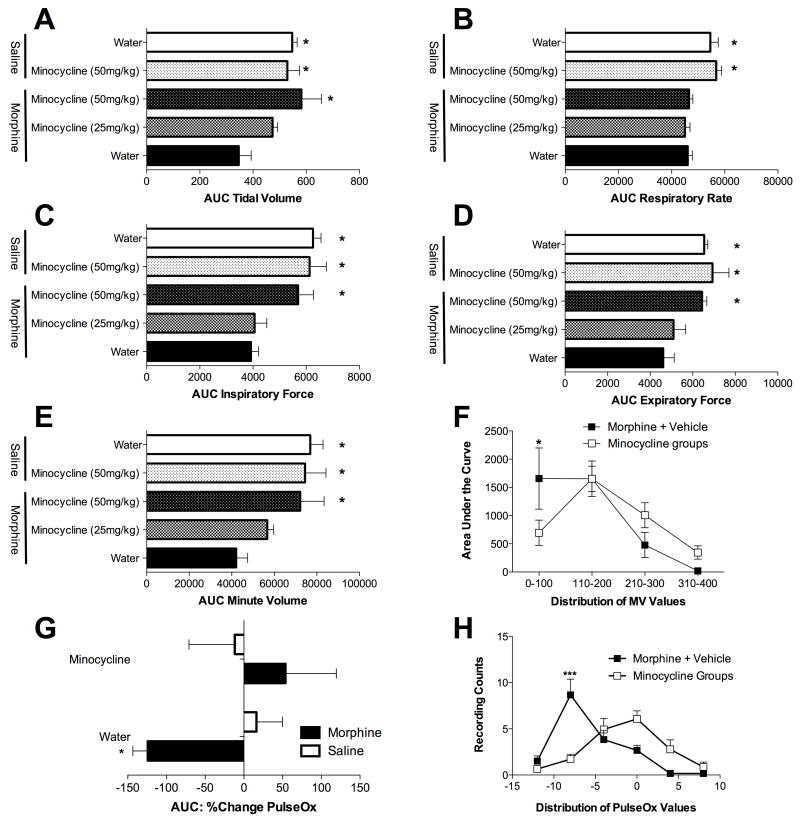
Figure 1. Minocycline attenuates morphine induced respiratory depression without effecting respiratory rate.
Morphine induced respiratory depression and its attenuation by minocycline were quantified using full body plesthysmography allowing the quantification of tidal volume (A), respiratory rate (B), minute volume (E), inspiratory force (C) and expiratory force (D). The data are displayed as area under the curve (AUC) for each parameter. (F) Analysis of the distribution of minute volume (MV) values reveals that morphine significantly increases very low minute volume values, consistent with significant respiratory depression. As distributions for minocycline+morphine and minocycline+vehicle groups were superimposable, these groups were pooled for simplicity of data presentation in this figure. (G) Morphine induced decreases in blood oxygen saturation (PulseOx), an effect significantly attenuated by minocycline. (H) Analysis of the distribution of PulseOx values reveals that morphine significantly increases low PulseOx values, consistent with significant respiratory depression which is attenuated by minocycline. A one-way ANOVA with Bonferroni posthoc test comparing morphine + water with each other data group. * = P < 0.05

