Fig. 3.
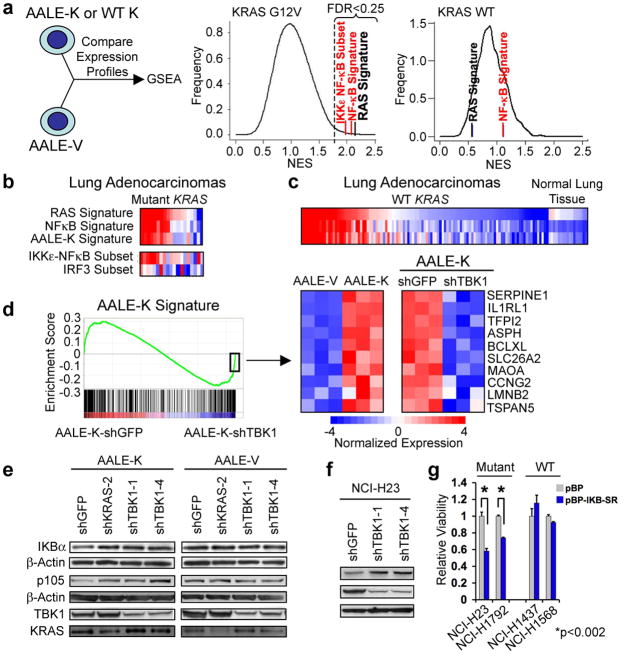
Oncogenic KRAS-induced NF-κB signaling involves TBK1 (a) GSEA of AALE-V (vector), AALE-K (KRAS G12V) or AALE-WT-K (KRAS WT) cells (positive NES). A RAS oncogenic signature (black) and NF-κB signatures (red) showed significant enrichment (FDR<0.25) in AALE-K cells. N.S. = non-significant. (b) RAS signatures in mutant KRAS lung adenocarcinomas correlate with NF-κB but not IRF3 signatures (red=activation, blue=inactivation). (c) RAS and NF-κB signature expression in WT KRAS lung adenocarcinomas and normal lung tissue. (d) AALE-K signature enrichment plot following shTBK1 or shGFP expression in triplicate samples. Heatmap shows top KRAS-induced genes with negative enrichment in AALE-K-shTBK1 samples. Immunoblot of IKBα, p105, TBK1, and KRAS in AALE-K and AALE-V cells (e) or NCI-H23 cells (f) following KRAS or TBK1 suppression. (g) Cell viability after expression of control vector (pBP) or IκBα-super-repressor (pBP-IKB-SR) in mutant or WT KRAS cells. Mean and SEM of triplicate samples shown, t-test for comparisons.

