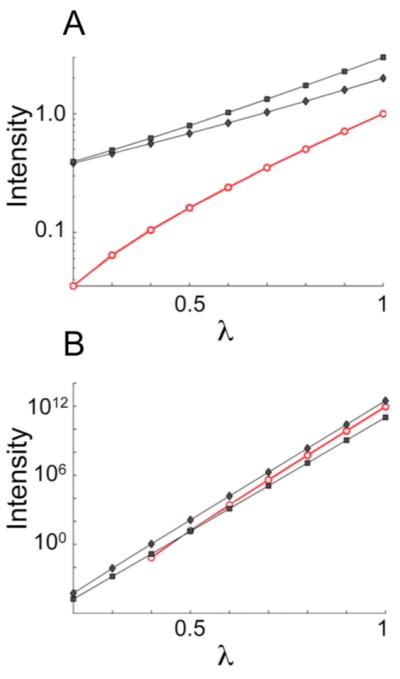
Figure 2.

Increase of covariance peak intensity with respect to the exponent (λ) used in transforming the generalized covariance matrix. (A) Log-linear plot tracking the intensity build-up with increasing λ for three example traces from the simulated spectra of Figure 1. (B) Analogous plot for an experimental generalized indirect covariance (GIC) HMBC*TOCSY spectrum of a metabolite mixture. In panel B, the black curves belong to myo-inositol (stronger peak) and glucose (weaker peak). In all panels, black traces with filled circles correspond to expected signals while red traces with open circles correspond to false positive signals. Note the characteristically higher slopes of the false positive traces.
