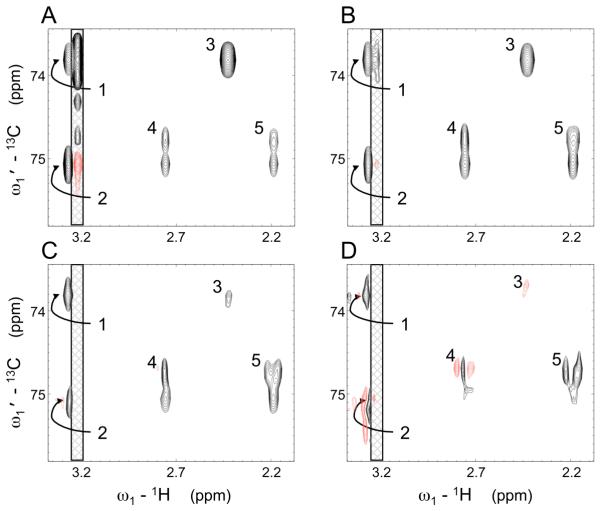
Figure 4.
Spectral region of [HMBC*TOCSY]λ spectrum of a metabolite mixture with (A) λ = 1, (B) λ = 0.75, (C) λ = 0.5, (D) λ = 0.25. Black contours indicate positive signals, and red contours, negative signals. The cross-hatched region indicates a noise ridge, which is suppressed by the matrix power of λ ≤ 0.5. Decreasing the value of λ also effectively suppresses peak (3), an artifact due to chemical shift near-degeneracy (pseudo-relay) between myo-inositol and carnitine 1H resonances. Peaks (1) and (2) arise from myo-inositol, while Peaks (4) and (5) arise from the geminal protons attached to C6 in the cyclohexene ring of shikimic acid. Their distorted line-shapes, particularly pronounced with λ = 0.25 (C,D) reflect J-splittings in the underlying HMBC and TOCSY spectra, corresponding to those observed in the 1D 1H spectrum of shikimic acid available via the BMRB.38

