Figure 3.
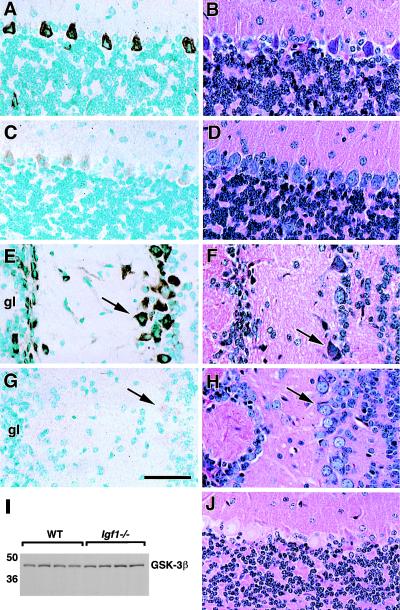
(A–H) GSK3β-ser9 phosphorylation and glycogen synthesis in cerebellar cortex (A–D) and olfactory bulb (E–H). Representative micrographs show immunostaining specific for ser9-phosphorylated GSK3β on the left-hand side of the figure, and glycogen-PAS staining is shown on the right side. WT sections are shown in A, B, E, and F, and Igf1−/− sections are shown in C, D, G, and H. Intense ser9-phospho-GSK3β staining of projection neurons (arrows) is seen in the WT but is barely detectable in the Igf1−/− brain. (I) GSK3β total protein levels assessed by immunoblot are the same in WT and Igf1−/−. (J) This section was pretreated with α-amylase to remove tissue glycogen before PAS staining. gl, glomerular layer. (Bar = 100 μm.)

