
Figure 6.
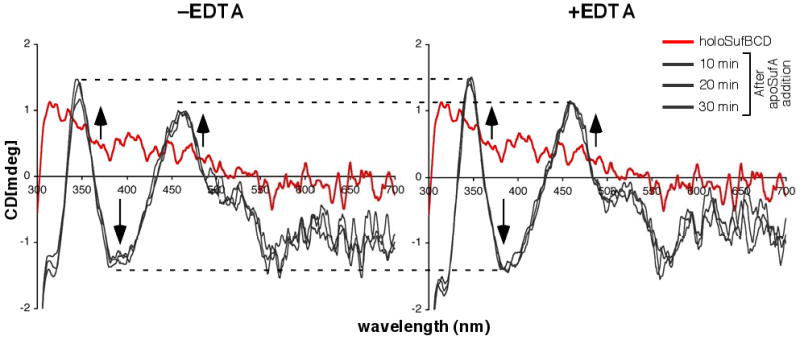
Monitoring Fe-S cluster transfer from holoSufBCD to SufA by CD spectroscopy. 280 μM holoSufBCD was mixed with 280 μM apoSufA in the absence (left panel) or presence (right panel) of 60 μM EDTA. Changes in CD spectra were monitored over time (grey traces). CD spectrum of holoSufBCD alone (red trace) is shown for reference. Dashed lines are shown to more easily compare relevant features between samples. Arrows indicate direction of change to CD spectra within each region over time upon apoSufA addition.