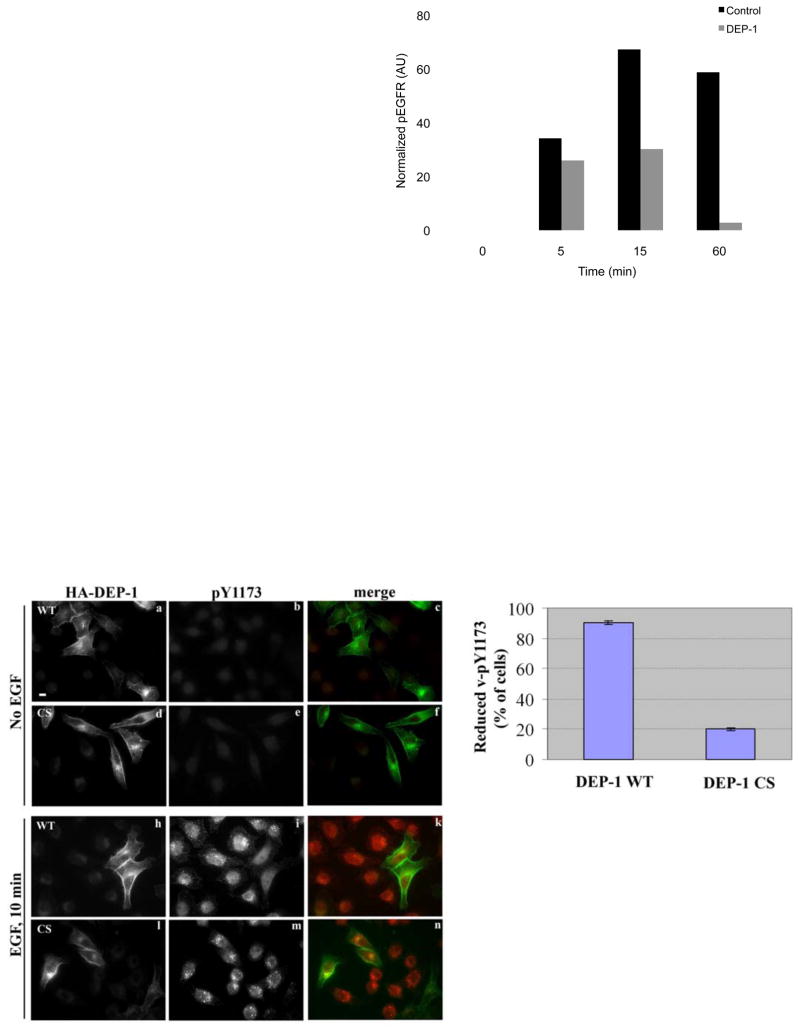
Figure 3. Ectopic DEP-1 Decreases Receptor Phosphorylation, Stabilizes EGFR and Inhibits Downstream Signalling.
(A) HeLa cells were transfected with a plasmid encoding HA-tagged DEP-1, or with a control expression vector, then incubated for 32h, serum-starved for 16h, and stimulated with EGF (20ng/ml) for the indicated time intervals. Thereafter, cell extracts were analyzed by immunoblotting.
(B) HeLa cells were treated as in A. EGFR phosphorylation was quantified and normalized. One representative experiment (n=3) is shown.
(C) HeLa cells were treated as in A and stimulated with EGF (20ng/ml) for the indicated intervals. Left panel: cells were processed for immunoblotting and densitometry of pERK1/2 levels (normalized to total ERK2 level; gERK). Right panel: cells were lysed, total RNA was prepared and used for reverse transcription. Real-time PCR was carried out with c-FOS primers.
(D) HeLa cells were transfected with plasmids encoding wild type HA-DEP-1 (a-c, h-k), or a catalytically inactive mutant (CS; d-f, l-n), then incubated for 32h, serum-starved for 16h (a-f) and stimulated with EGF (20ng/ml) for 10min (h-n). Cells were then fixed and analyzed by immunofluorescence using an antibody to HA (a, d, h, l) or to phosphorylated EGFR (pY1173; b, e, i, m). Images of phosphorylated EGFR were taken at the same exposure time. Endogenous phosphorylated EGFR appears green and DEP-1 appears red. One representative experiment is shown (n=2). Scale bar: 10 μm.
(E) HeLa cells expressing DEP-1 (WT or CS) were treated as in D. The histogram compares the fractions of cells (±S.D.) displaying vesicular pY1173 in three independent measurements (>100 cells).

