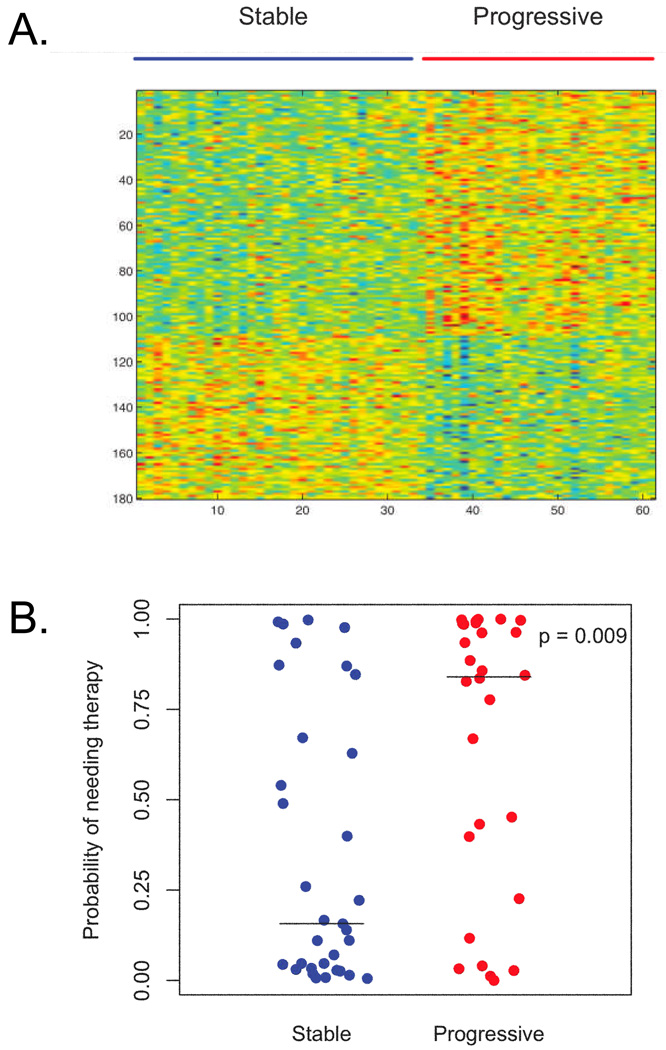
Figure 1. Genomic Signature of Disease Progression.
Panel A: Heatmap of the 180-gene signature differentiating CLL samples from patients who did not require therapy (stable disease, n = 33 samples) from those who did require therapy (progressive disease, n = 28 samples). Red color represents upregulated genes and blue color represents downregulated genes.
Panel B: Leave-one-out cross validation score of fitting the 180-gene signature for the 33 samples in the stable group and the 28 samples in the progressive group. The median values for the stable and progressive groups are denoted by horizontal lines and were 0.157 and 0.840, respectively. P value was determined by Wilcoxon rank sum test.

