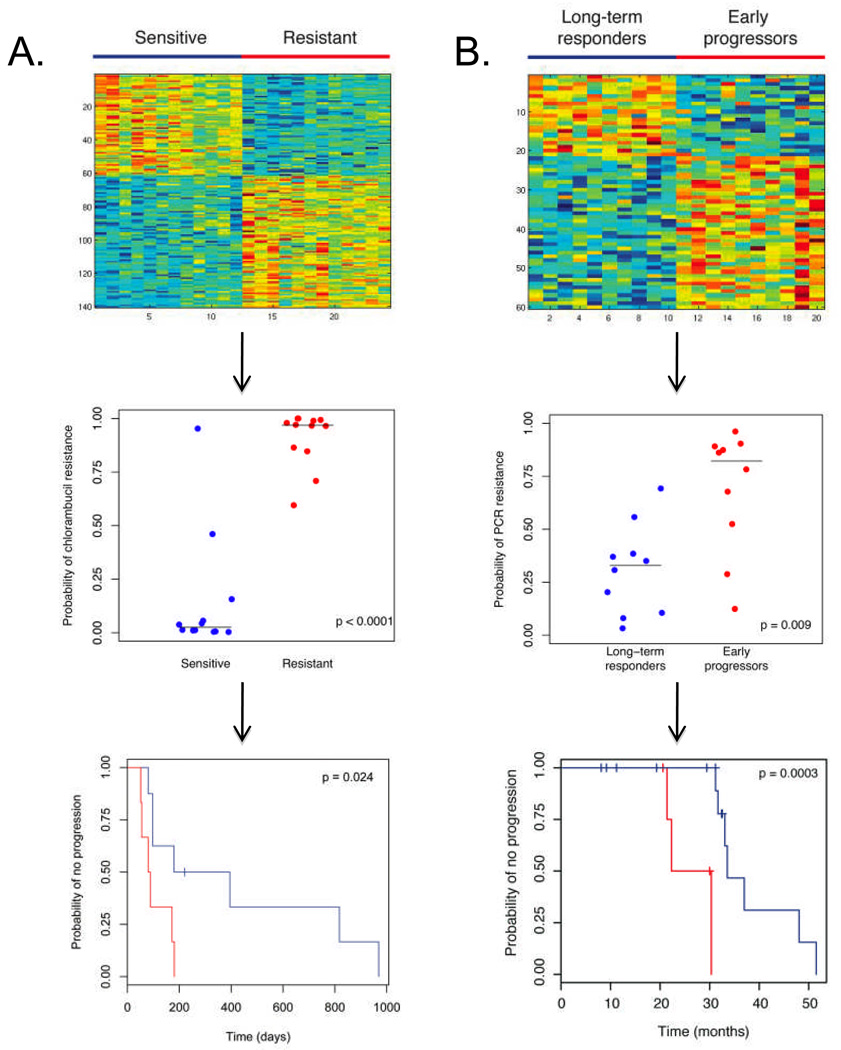
Figure 3. Genomic Signatures of Chemotherapy Sensitivity Applied to Clinical Data.
Panel A: The top figure demonstrates the heatmap of the 140-gene signature of resistance to chlorambucil, created from gene expression profiling of cell lines sensitive and resistant to this agent. Red color represents upregulated genes while blue color represents downregulated genes. The middle figure displays the leave-one-out cross validation values for the training data set. The horizontal lines represent median predicted values for the sensitive and resistant groups, 0.025 and 0.969 respectively. As seen in the bottom figure, when applied to genomic data of CLL cells from patients subsequently treated with chlorambucil, this signature can discriminate patients based on clinical response to therapy, with blue color denoting a prediction of more durable response (prediction score < 0.5, n = 8) and red color denoting a prediction of less durable response (prediction score ≥ 0.5, n = 6). P-value determined by log-rank test.
Panel B: The top figure demonstrates the heatmap of the 60-gene signature of resistance to pentostatin, cyclophosphamide, and rituximab (PCR), created from genomic data from patients who progressed early or were long-term responders. Red color represents upregulated genes while blue color represents downregulated genes. The middle figure displays the leave-one-out cross validation values for the training data set. The horizontal lines represent median predicted values for the long-term responder and early progressor groups, 0.329 and 0.822 respectively. As seen in the bottom figure, when applied to the genomic data from an additional 20 patients treated with this regimen and using a cut-off of 0.5, this signature can separate patients based on response, with blue color denoting a prediction of long-term response (n = 15) and red color denoting a prediction of early progression (n = 5). P-value determined by log-rank test.

