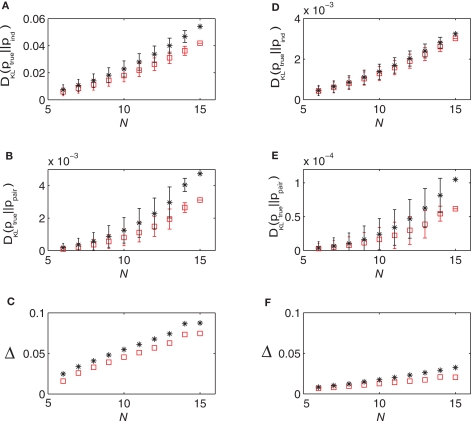
Figure 3.
The quality of the pairwise and independent models for different time bins and populations sizes. (A) DKL(ptrue || Pind) versus N, (B) DKL(ptrue || ppair) versus N and (C) Δ versus N all for δt = 10 ms. (D–F) show the same things for δt = 2 ms. In all panels, the black stars represent quantities as computed directly from the simulated data, while the red squares show the predictions of the low-rate expansion, i.e. Eqs. 15 and 16. We have used 18000 s of simulated data for computing the plotted quantities and have corrected for finite sampling bias as described in Roudi et al. (2009b).

