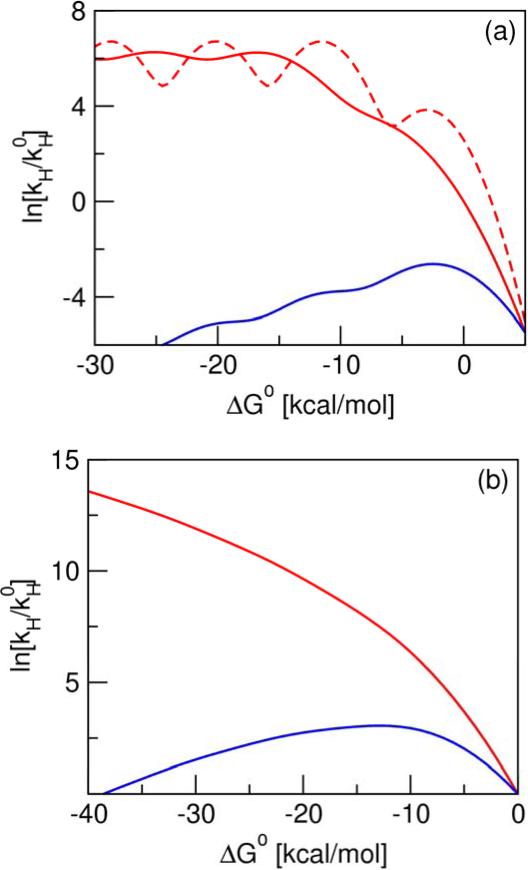
Figure 4.
Driving force dependence of the rate constant for (a) electronically adiabatic PT and (b) PCET models. In the electronically adiabatic PT model, ω = 3000 cm−1, and the proton transfer barrier frequency and height are 2500 cm−1 and 7 kcal/mol, respectively. The reorganization energy is λ = 8 kcal/mol for the two solid curves and λ = 3 kcal/mol for the dashed curve. In this model, the red curves correspond to a fixed proton transfer barrier, and the blue curve corresponds to the increase of the barrier as a function of ΔG0 with a slope of 0.6667, leading to an increase in the barrier height from 7 kcal/mol to 25 kcal/mol for the range of ΔG0 shown here. In both cases, the vibronic coupling for vibrational states above the barrier was estimated as half the splitting between the third and fourth vibrational states for the fixed barrier. In the PCET model, λ = 20 kcal/mol, ω = 3000 cm−1, and δx = 0.5 Å. In this model, the red curve corresponds to a fixed proton donor-acceptor distance, and the blue curve corresponds to the increase of this distance as a function of ΔG0 with a slope of 0.00714 Å (kcal/mol)−1, leading to an increase in δx from 0.5 Å to 0.8 Å for the range of ΔG0 shown here. The temperature is 300 K for all models, and is the rate constant for ΔG0 = 0 for the PT model with fixed barrier and λ = 8 kcal/mol in (a) and for both PCET models in (b).

