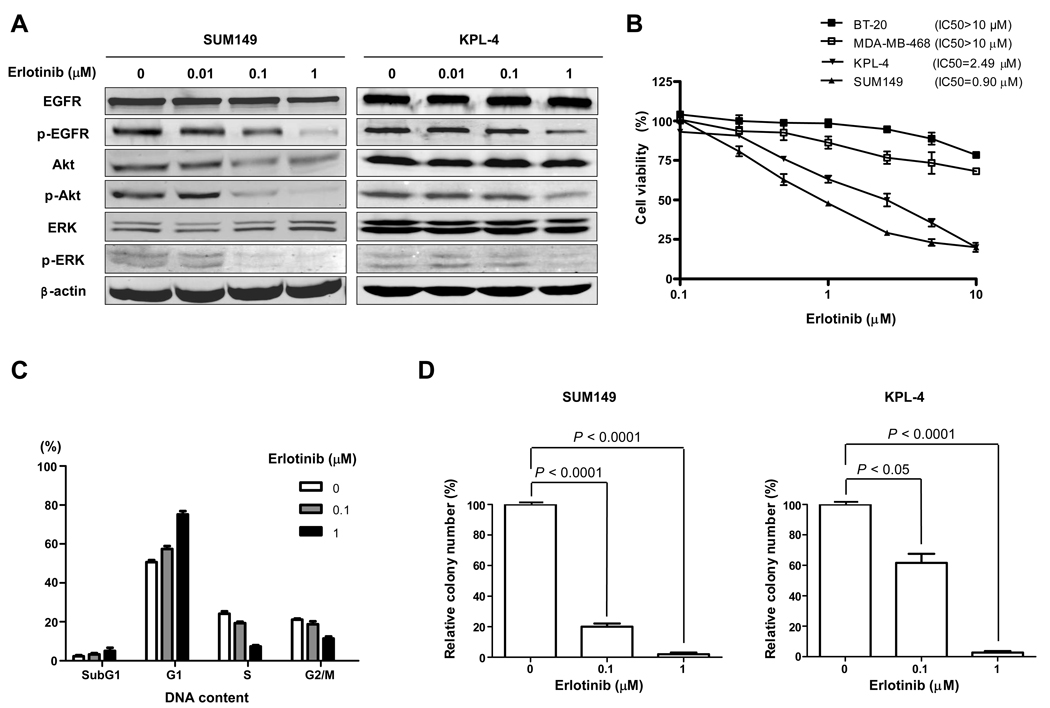
Fig. 2.
IBC cells are sensitive to erlotinib. A, SUM149 and KPL-4 cells were treated with 0 (vehicle), 0.01, 0.1, or 1 µM erlotinib for 72 h. Western blot analysis was performed to detect EGFR, p-EGFR, Akt, p-Akt, ERK, and p-ERK. β-actin was used as a loading control. B, SUM149, KPL-4, MDA-MB-468, and BT-20 cells were plated in 96-well plates and treated with 0.1, 0.25, 0.5, 1, 2.5, 5, or 10 µM erlotinib for 3 days. WST-1 assay was performed to quantify the activity of erlotinib. C, SUM149 cells were treated with 0, 0.1, or 1 µM erlotinib for 48 h, and FACScan analysis was performed to detect the cell cycle distribution. D, SUM149 and KPL-4 cells were plated in soft agar with 0, 0.1, or 1 µM erlotinib to determine the anchorage-independent growth. Differences in the colony numbers were measured 21 days later. P values are indicated. Each experiment was repeated 3 times independently.

