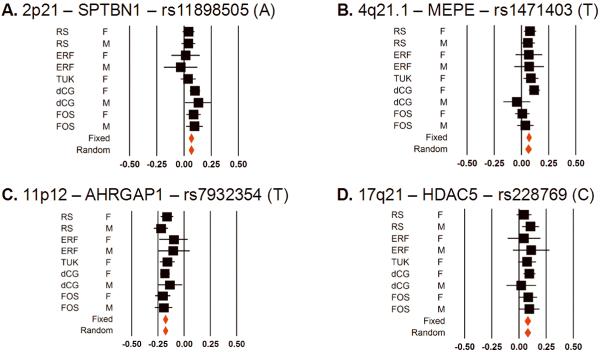
Figure 4.
Forest Plots for the top SNPs for each of the 4 loci attaining GWS for the first time in this study: A. 2p21, B. 4q21.1, C. 11p11.2, D. 17q21. Black squares represent effect estimate and 95%CI for each study, and the red diamonds are summary effect estimates. Measurements units are in BMD standard deviations (SD).

