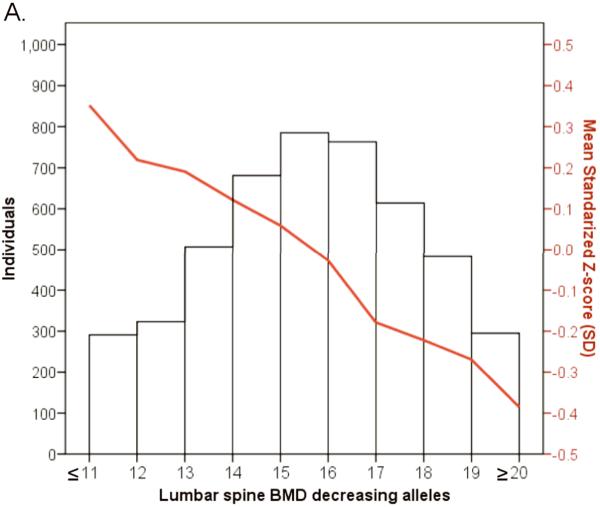
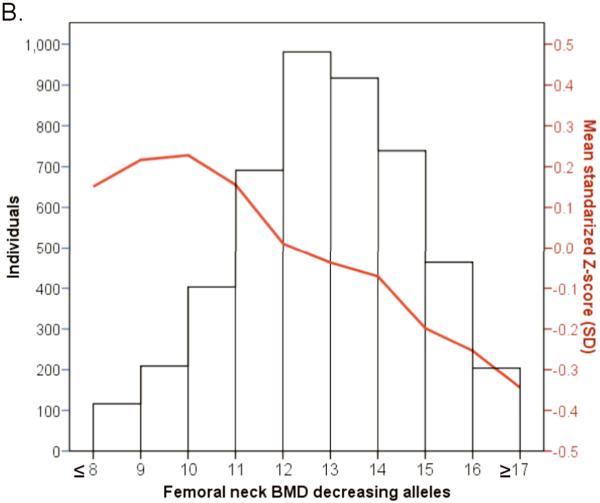
Figure 5.
Histogram and line plot modeling in the Rotterdam Study the combined allelic effect across all genome-wide significant associated loci for A. Lumbar Spine BMD and B. Femoral neck BMD. Subjects were classified according to the number of BMD decreasing (risk) alleles at the lumbar spine BMD (20 SNPs) and the femoral neck (15 SNPs). The mean for each risk allele-count group was determined and the extremes of the distribution counts were pooled into the nearest risk allele-count group of size >100 individuals.


