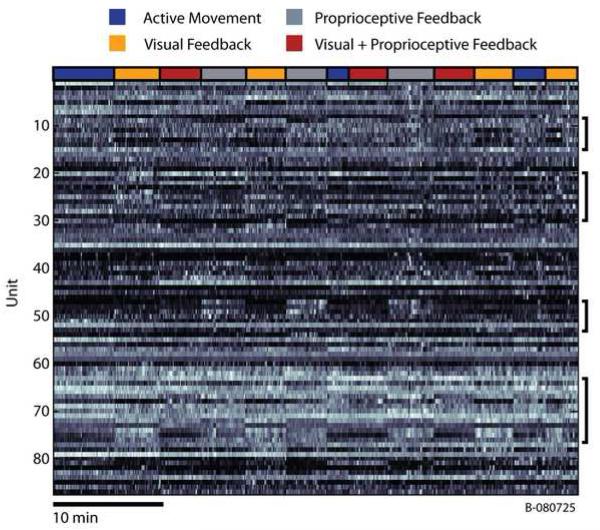
Figure 2.
Time series of binned firing rates for all units recorded during a single session (B080725). Firing rates from each individual neuron were binned (50 ms bin size) and normalized to their maximum firing rate. The resulting time series were then smoothed using a zero-phase, 4th order, butterworth, lowpass filter with a cutoff frequency of 0.1Hz for display purposes. Bins shown in white represent the highest firing rates for each cell, while those areas shown in black correspond those time when the firing rate was very low. Notice the substantial changes in the firing rates of some cells at the transitions between experimental conditions (especially those cells denoted by the black brackets). The colored bar at the top of the figure shows the transitions between the 4 experimental conditions.

