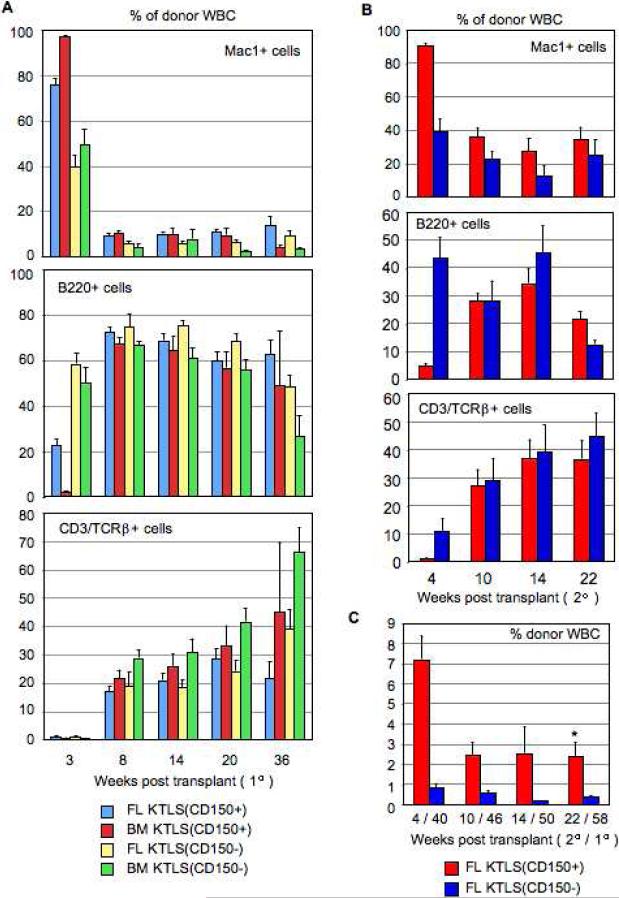
Figure 5.
Lineage potential of KTLS(CD150+) and (CD150−) cells on primary and secondary transplant show initial myeloid and later lymphoid cell output. (A): Primary transplant data (n = 7 per experimental group; n = 28 total) shows the percentage (mean ± s.e.m.) of Mac1+ (myeloid, M, lineage), B220+ (B lineage) and CD3/TCRβ+ (T lineage) cells within the donor-derived white blood cell compartment. (B): Secondary transplant data (n = 7 per experimental group; n = 14 total) shows the percentage (mean ± s.e.m.) of M, B and T lineage cells within the donor-derived white blood cell compartment. (C): Quantitative and kinetic analysis of the percentage (mean ± s.e.m.) of donor-derived WBC reconstitution levels in the peripheral blood of irradiated recipient mice engrafted with 100 KTLS(CD150+) and 100 KTLS(CD150−) cells on secondary transplant.

