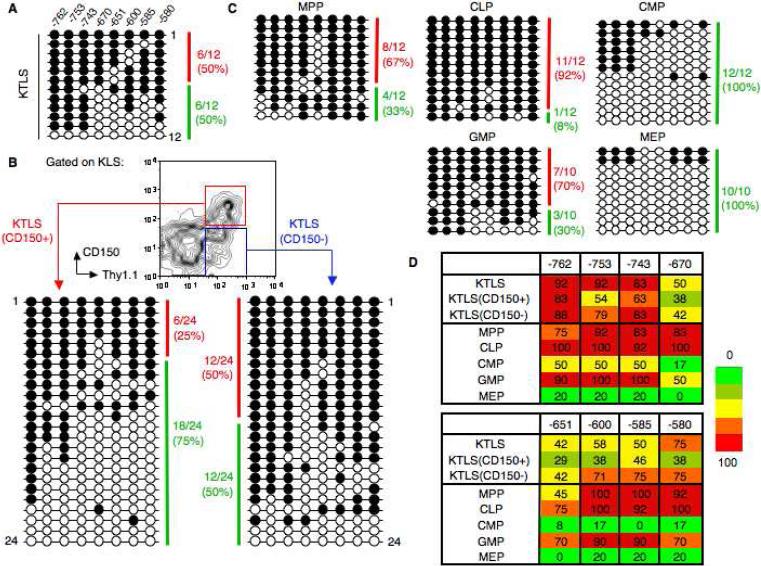
Figure 6.
Bisulfite sequencing of the Gata1 enhancer reveals heterogeneity within the KTLS subset which can separated with CD150. (A): Bisulfite analysis of a 182-bp Gata1 enhancer in wild-type KTLS cells from 8 week BM. Each horizontal line represents an independently sequenced template with methylated (filled circles) and unmethylated CpGs (open circles). A heavily methylated clone (red) was classified as having >80% CpG dinucleotides methylated whereas a clone that was not heavily methylated (green) had <80% CpGs methylated. (B): Bisulfite analysis of Gata1 enhancer in KTLS cellular subsets purified according to expression of CD150 from BM. (C): Bisulfite analysis of Gata1 enhancer in five purified progenitor populations from BM. (D): Heatmap summary of the DNA methylation profile for the Gata1 enhancer in purified HSCs and progenitors. Methylation levels are represented in a gradation of colors from green (0-20%), olive (21-40%), yellow (41-60%), orange (61-80%), and red (81-100%). The number of methylated clones over total clones selected for sequencing (10-24 clones) is expressed as a percentage.

