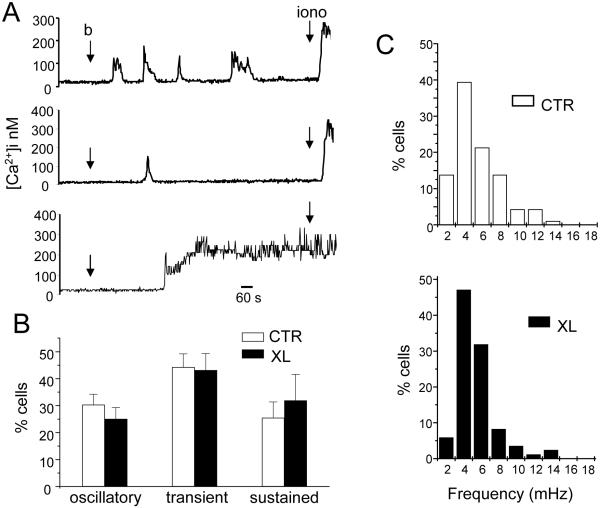
Figure 5.
Blockade of Kv1.3 movement to the immune synapse does not affect the distribution of Ca2+ responses and the frequency of oscillations. A. Representative Ca2+ responses induced by CD3/CD28 beads in individual cells. The points of introduction of the beads (b) and ionomycin (iono, 1-2 μM) into the bath are indicated by arrows. Contact with beads triggered various responses including oscillatory (top), transient (middle) and sustained (bottom) Ca2+ responses. B. Average [Ca2+]i response distribution in CTR and XL cells. Number of cells displaying a transient, sustained or oscillatory response are reported as normalized for the total number of T cells that show an increase in [Ca2+]i upon exposure to beads. The data are the average of 8 experiments (same experiments shown in Fig. 4). C. Distribution of oscillation frequencies. The distribution of oscillation frequencies for CTR and XL cells are shown in the top and bottom panels, respectively (n=8 experiments and a total of 94 cells for CTR and 85 for XL). Results are presented as percentage of cells, within the oscillating population, displaying a particular frequency.

