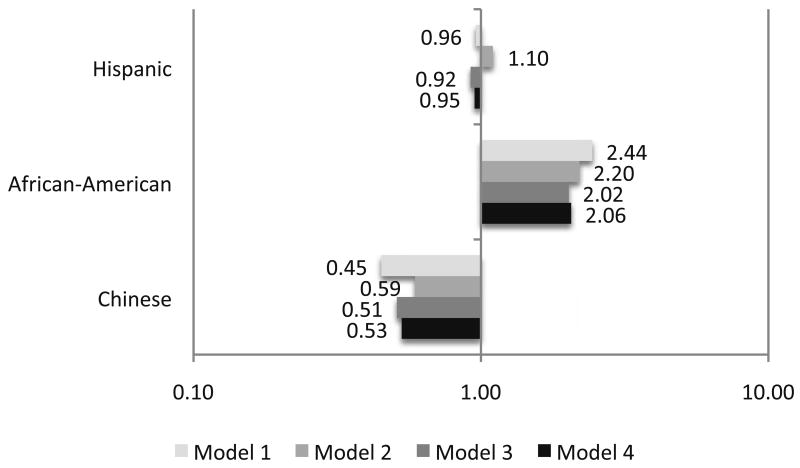
Figure 1. Ethnicity and the Odds of Progressing into the Low ABI Group* over 3 Years: The Multi-Ethnic Study of Atherosclerosis.
*Defined as an ABI ≤ 0.90 (non-Hispanic White Americans are the reference group).
Model 1 – Adjusted for age and sex
Model 2 – Adjusted for age, sex, body mass index, hypertension, diabetes, smoking and dyslipidemia
Model 3 – Adjusted for age, sex, body mass index, hypertension, diabetes, smoking, dyslipidemia, new hypertension and new dyslipidemia
Model 4 - Adjusted for age, sex, body mass index, hypertension, diabetes, smoking, dyslipidemia, family history of CVD new hypertension, new dyslipidemia and homocysteine

