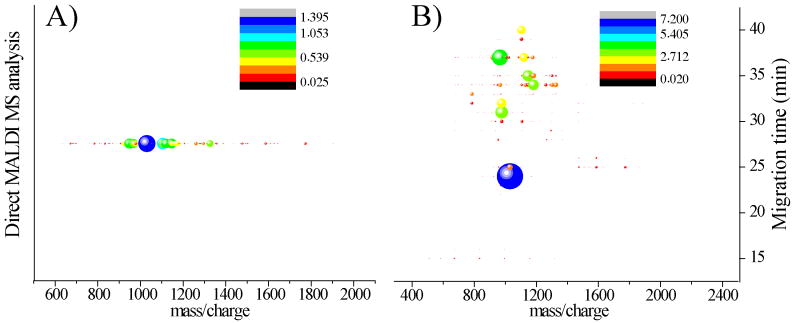
Fig.4.
Bubble mapped 2D plot of the MALDI-MS data comparing the neuropeptide signals obtained from: (A) 500 nL of single PO extract without CE separation, and (B) 50 nL sample after CE separation. Larger bubbles indicate more intense peptide signals (see the color scale). Y axis in panel B) shows the migration time in CE. CE conditions are different from Fig. 3 in DHB buffer pH (2.66), voltage (-16 kV) and capillary total length (77 cm).

