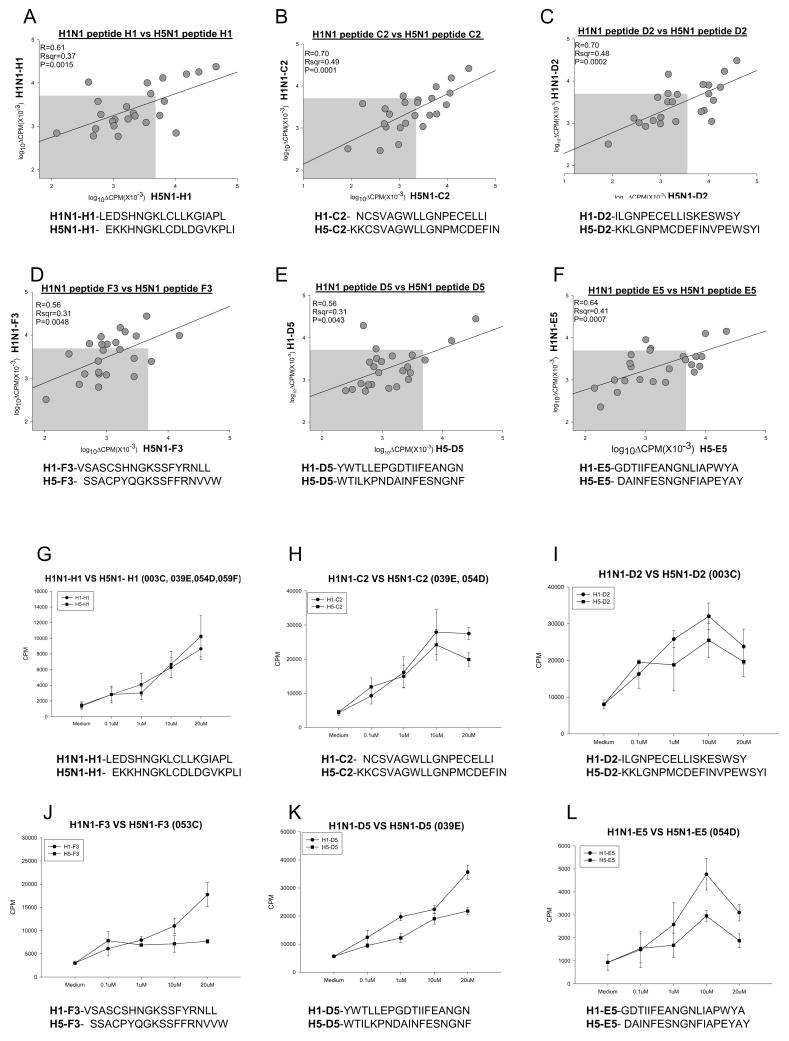
Figure 6.
T cell proliferative response to H1 and H5 18mer peptides are biased towards H1. Pair-wise comparison of peptide specific responses by 24 subjects; peptide sequences are indicated in the graph and in Table 1(A–F). Titration curves of H1 peptide response in comparison to corresponding H5 peptide (G–L). Subject identifiers are indicated in the heading of each graph. In panels G and H, responses by indicated subjects are presented as the mean ± SE of the pooled individual responses. Gray box indicates statistical cutoff for non-responders. Statistical values were calculated using SigmaPlot 2000.

