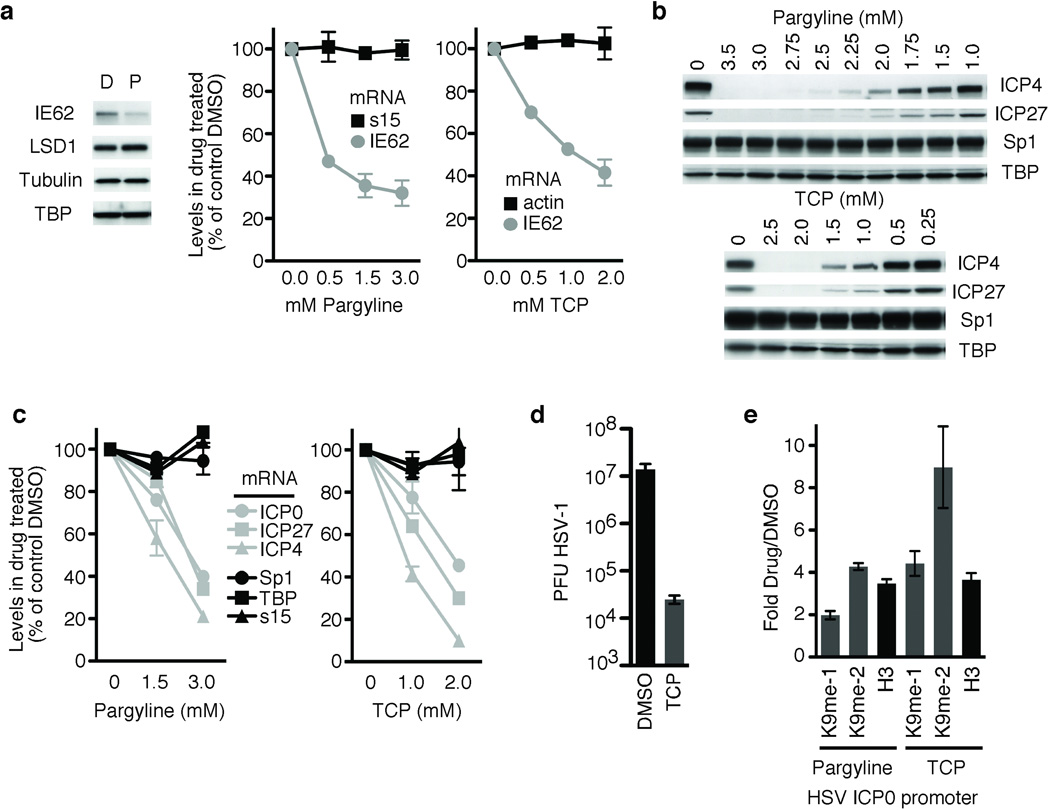
Figure 3. Inhibition of LSD1 with MAOIs blocks α-herpesviral lytic gene expression.
(a) Western blot showing Pargyline (P) mediated inhibition of VZV IE gene expression (IE62) in cells infected with VZV for 4 hrs relative to control DMSO (D). LSD1, Tubulin, and TBP control proteins are shown. qRT-PCR of IE62 and control (s15, actin) mRNA levels in cells infected with VZV for 4 hrs in the presence of increasing amounts of Pargyline or Tranylcypromine (TCP). The results are graphed as the percent of levels in control treated cells. (b) Western blot showing inhibition of HSV IE protein expression (ICP4, ICP27) at 4 hours post HSV-1 infection in cells treated with increasing concentrations of either Pargyline or TCP. Control proteins (Sp1, TBP) are shown. (c) qRT-PCR analyses of mRNA levels of HSV IE genes and controls (Sp1, TBP, s15) in cells treated with selected concentrations of Pargyline or TCP. (d) Viral yields from cells infected with 0.1 plaque forming units (PFU) HSV-1 per cell in the presence of 2 mM TCP or control DMSO for 24 hrs. (e) ChIP assay showing histone H3 and H3K9 methylation on the HSV-1 IE0 promoter in the presence of 3 mM Pargyline or 2 mM TCP at 4 hrs post HSV-1 infection. The results are shown as ratios of occupancy in drug treated cells to those in control DMSO treated cells. The data is normalized to the ratio of total H3 in drug treated/DMSO treated cells at the cellular actin promoter. me-1, mono-methyl; me-2, di-methyl; H3, total histone H3.

