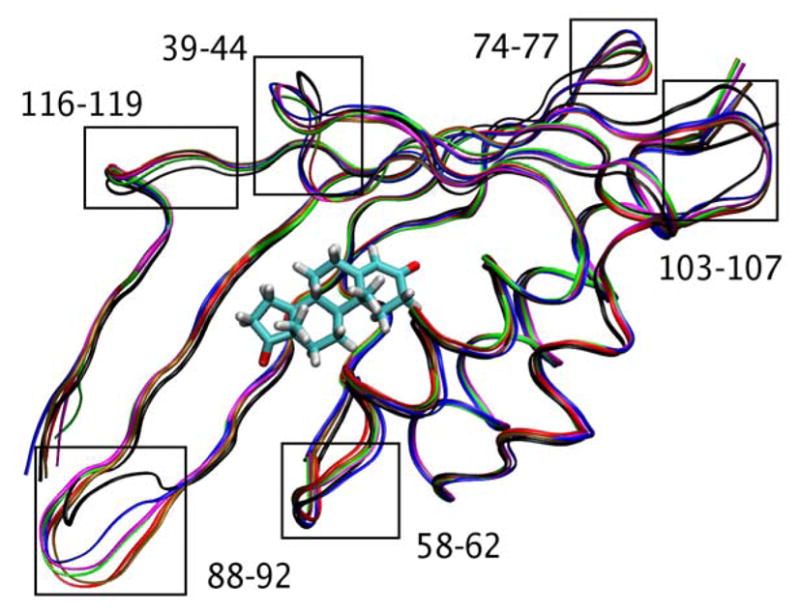
Figure 7.

Thermally averaged structures of KSI along the reaction pathway for both proton transfer reactions. The reactant state (black), transition state (red) and product state (green) for the first proton transfer step and the reactant state (brown), transition state (magenta) and product state (blue) for the second proton transfer step are presented. The loop regions exhibiting significant structural changes are labeled. A version of this figure separating the structures for the two proton transfer steps is given in Supporting Information.
