
Figure 1. DRB reversibly inhibits new transcription by RNA polymerase II.
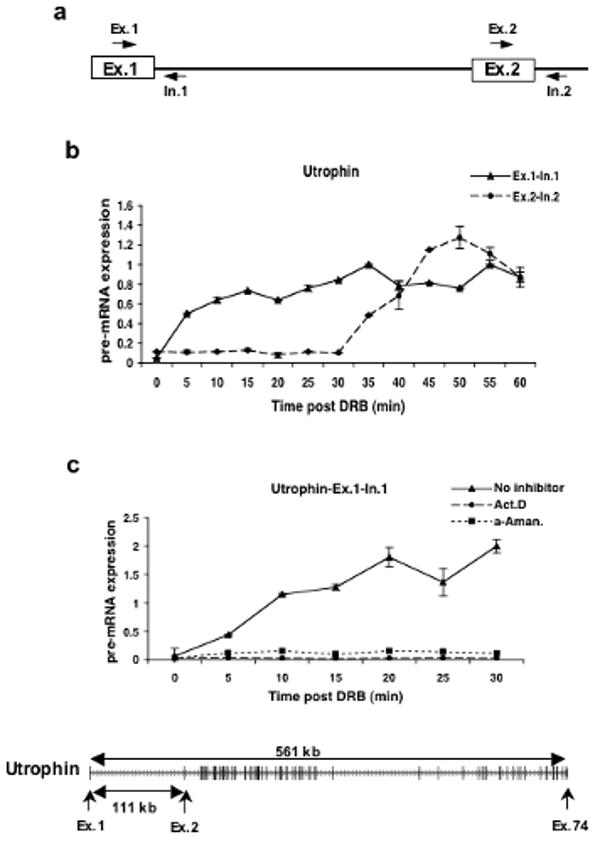
a) Schematic diagram showing the primer sets used to amplify the exon-intron junctions of exons 1 and 2 of the Utrophin gene.
b) Quantitative RT-PCR was used to measure the expression levels of Utrophin pre-mRNA in the exon 1 and exon 2 regions of the gene. Cells were first treated with 100μM of DRB for 3hrs and then fresh medium was added after DRB removal. The cells were harvested at 5 minute intervals for RNA isolation and qRT-PCR. The expression values are plotted relative to the expression level of the no treatment control which is set to 1 in all experiments.
c) Effect of actinomycin D (Act. D) and α-amanitin (α-Aman.) on transcription of the first exon-intron junction of the Utrophin gene after DRB treatment. Cells were treated with DRB for 3hrs and either actinomycin D or α-amanitin was added 30 minutes prior to the removal of DRB. Cells were released from DRB but maintained in the other drugs. Cells were harvested at 5 minute intervals and quantitative RT-PCR was performed as above to measure the levels of expression of the exon1-intron 1 region of the Utrophin gene. Shown at the bottom is the exon/intron structure of the Utrophin gene. Transcription is from left to right and the exons are represented as larger vertical bars.