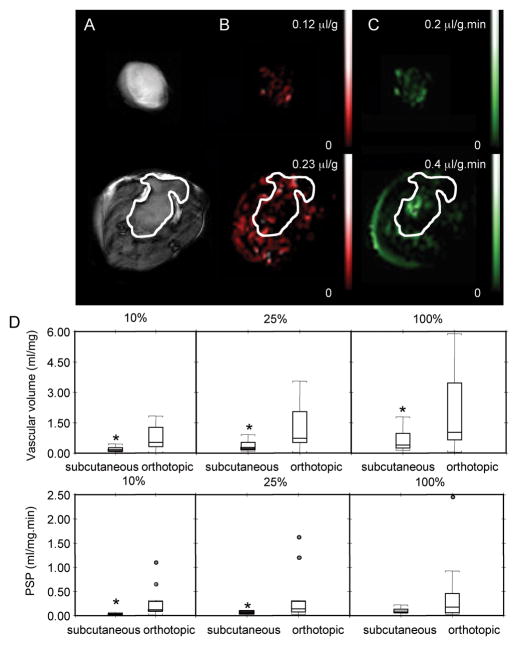
Figure 1.
Vascular analyses of subcutaneous (upper panel) and orthotopic (lower panel) tumors. (A) Diffusion-weighted images, (B) vascular volume maps, (C) PSP maps (scale bar = 5 mm) of a subcutaneous tumor (344 mm3) and an orthotopic tumor (367 mm3). Diffusion-weighted images were acquired with an in-plane spatial resolution of 250 μm, vascular volume maps and PSP maps were acquired with an in-plane spatial resolution of 125 or 250 μm respectively. (D) Box-and-whisker plots of total vascular volume and total PSP in subcutaneous (n=9) and orthotopic (n=12) tumors. The three plots represent analysis of the highest 10%, 25%, and all VV pixels (*p ≤ 0.05).

