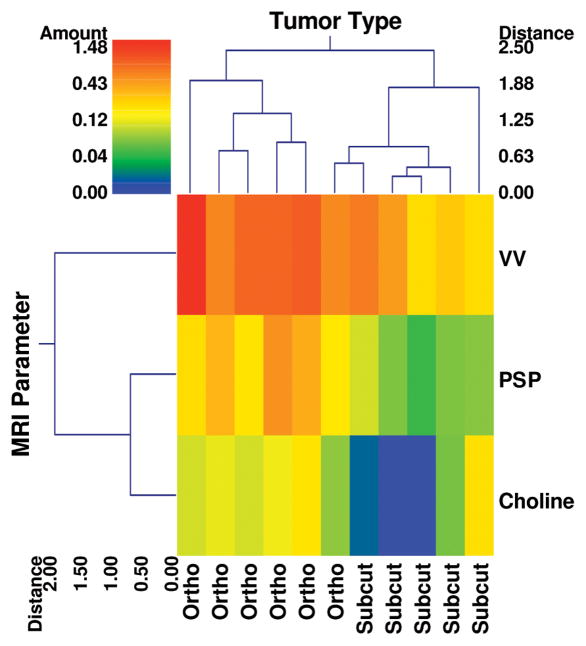
Figure 3.
A double dendrogram illustrating the feasibility of clustering orthotopic and subcutaneous microenvironments on the basis of three imaging parameters measured in vivo: vascular volume (VV), permeability-surface-area-product (PSP) and total choline concentration. The color bar represents the range of the variables color coded according to a log scale to accommodate the entire dynamic range of each variable. VV, PSP and total choline data clustered into two distinct groups, with the orthotopic group exhibiting elevated values for each parameter (hotter colors) compared to the subcutaneous group. The distance axis on the dendrogram represents the distance or dissimilarity between the two clusters. Also, apparent from this “double” dendrogram is that the PSP and total choline cluster together for this group of animals.

