
Figure 5.
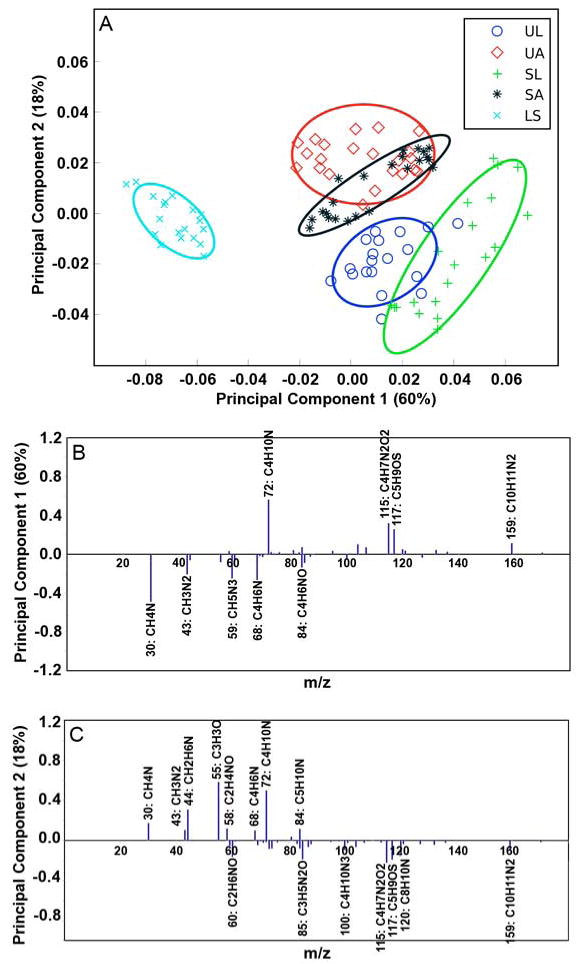
Principal component scores and loadings for UBM, SIS, and LECM samples. (A) PC1 vs. PC2 scores plot for the luminal surface of UBM (circle), the abluminal surface of UBM (diamond), the luminal surface of SIS (cross), the abluminal surface of SIS (asterisk), and the surface of LECM (x). All results are presented with 95% confidence interval (35). (B) Loadings for PC1. (C) Loadings for PC2. Peaks with loadings greater than 0.1 are labeled with their respective ion.