
Figure 7.
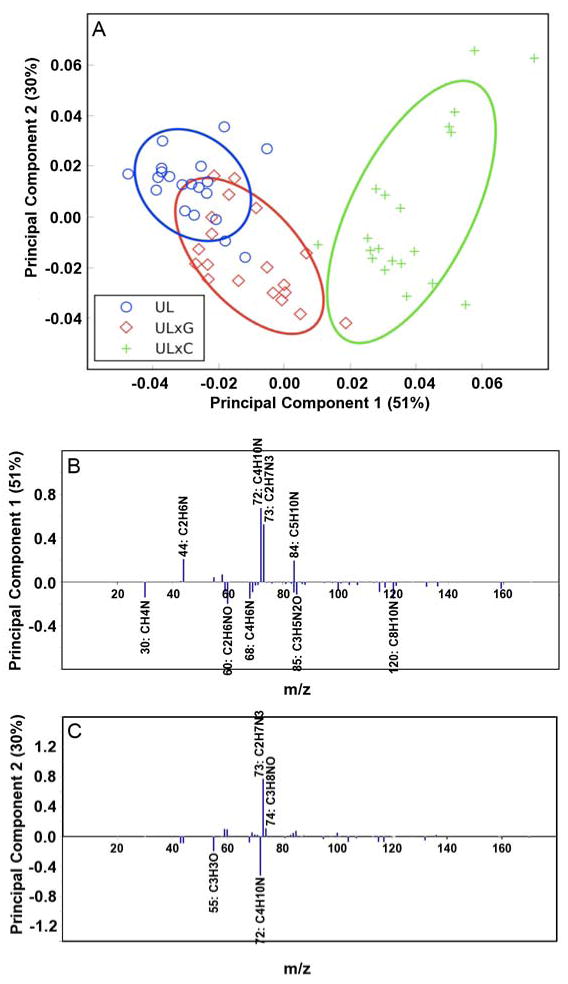
Principal component scores and loadings for the luminal sides of UBM, UBM-CDI (ULxC) and UBM-GLUT (ULxG) samples. (A) PC1 vs. PC2 scores plot for the luminal surface of UBM (circle), the luminal surface of UBM-GLUT (diamond), and the luminal surface of UBM-CDI (cross). All results are presented with 95% confidence interval (35). (B) Loadings for PC1. (C) Loadings for PC2. Peaks with loadings greater than 0.1 are labeled with their respective ion.