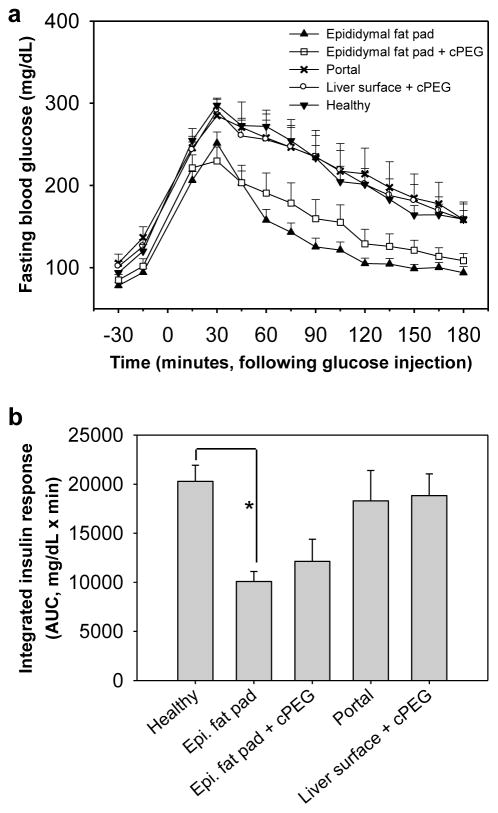
Fig. 4.
Real-time graft performance in intraperitoneal glucose tolerance test. (a) Mean fasting blood glucose over time, following intraperitoneal injection of 10% glucose. Test groups were composed of normoglycemic mice previously transplanted at the sutured epididymal fat pad (▲, n=7); at the epididymal fat pad with adhesive immobilization (□, n=8); via intrahepatic portal delivery (x, n=7); at the liver surface with adhesive immobilization (○, n=8); as well as healthy untreated control mice (▼, n=5). (b) Integrated insulin response to intraperitoneal glucose injection, calculated by group. Asterisk (*) indicates statistical difference in mean area under blood glucose excursion curve (AUC) between the sutured epididymal fat pad and healthy control groups (p < 0.05).

