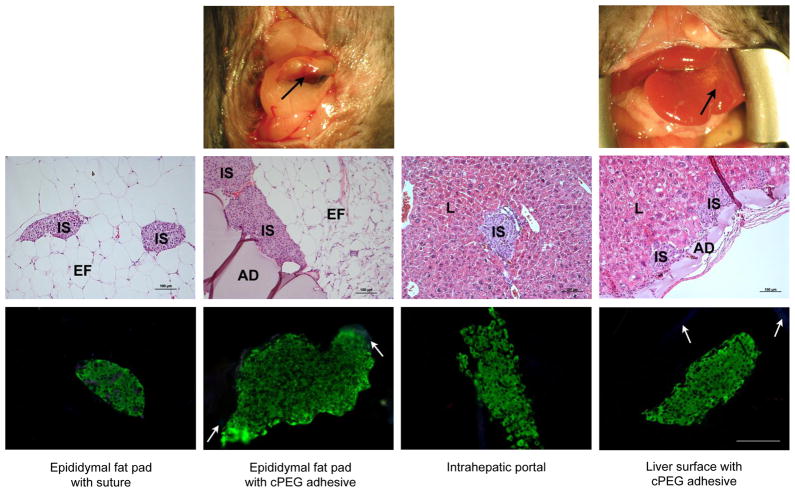
Fig. 5.
Analysis of islet graft and cPEG adhesive explants. Top row: photographic images of the site of cPEG adhesive-mediated 150-islet transplantation at the epididymal fat pad and liver surface, immediately prior to graft explant on day 112. Immobilized islet bolus is visible on the external liver surface. Black arrows, cPEG adhesive. Middle row: representative light micrographs of hematoxylin and eosin (H&E)-stained graft explants. Adhesive, AD; islet, IS; epididymal fat tissue, EF; liver tissue, L. Scale bars: 100 μm. Bottom row: representative fluorescent micrographs of immunohistochemical triple-stain of graft explants. Insulin, green; OX-41 (macrophage marker), blue; CD31 (endothelial cell marker), red. White arrows, non-specific cPEG labeling. All images, scale bar: 100 μm.

