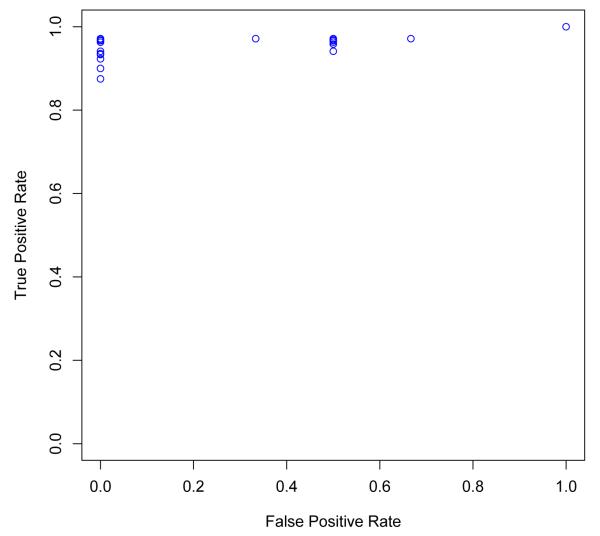
Fig. 3.
The set of predictions that the DIKB makes is influenced by varying the LOEs chosen as belief criteria for each assertion type. Since LOEs are rank-ordered there is no way to create a continuous receiver operating characteristic (ROC) curve. This figure shows a scatter plot of the true-positive rate (sensitivity) versus the false-positive rate (1.0 — specificity) over the 7,488 belief criteria strategies for which both values could be calculated. The system made no “true negative” or “false positive” predictions using the strategy chosen by the drug experts so, its performance using that strategy cannot be shown in the scatter-plot.

